Database Reference
In-Depth Information
P
DT
(
pos
x
i
). The typical threshold value of 0.5 means that the predicted
probability of “positive” must be higher than 0.5 for the instance to be
predicted as “positive”. By changing the value of
τ
, one can control the
number of instances that are classified as “positive”. Thus, the
τ
value can
be tuned to the required quota size. Nevertheless, because there might be
several instances with the same conditional probability, the quota size is
not necessarily incremented by one.
The above discussion is based on the assumption that the classification
problem is binary. In cases where there are more than two classes,
adaptation could be easily made by comparing one class to all the others.
|
4.2.6.1
ROC Curves
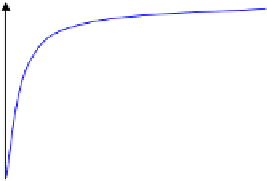
Another measure is the ROC curves which illustrate the tradeoff between
true positive to false positive rates
[
Provost and Fawcett (1998)
]
. Figure 4.3
illustrates a ROC curve in which the
X
-axis represents a false positive rate
and the
Y
-axis represents a true positive rate. The ideal point on the ROC
curve would be (0,100), that is, all positive examples are classified correctly
and no negative examples are misclassified as positive.
The ROC convex hull can also be used as a robust method of identifying
potentially optimal classifiers [Provost and Fawcett (2001)]. Given a family
of ROC curves, the ROC convex hull can include points that are more
towards the north-west frontier of the ROC space. If a line passes through
a point on the convex hull, then there is no other line with the same
slope passing through another point with a larger TP intercept. Thus, the
classifier at that point is optimal under any distribution assumptions in
tandem with that slope.
True positive
rate
1
0.8
0.6
0.4
False
positive
rate
1
0.8
0.6
0.4
0.2
Fig. 4.3
A typical ROC curve.


Search WWH ::

Custom Search