Database Reference
In-Depth Information
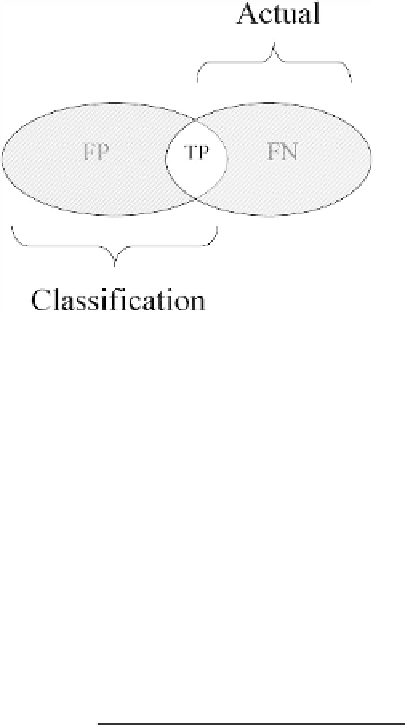
Fig. 4.2
A graphic explanation of the F-measure.
The intuition behind the F-measure can be explained using Figure 4.2.
Figure 4.2 presents a diagram of a common situation in which the right
ellipsoid represents the set of all defective batches and the left ellipsoid
represents the set of all batches that were classified as defective by a certain
classifier. The intersection of these sets represents the true positive (TP),
while the remaining parts represent false negative (FN) and false positive
(FP). An intuitive way of measuring the adequacy of a certain classifier is
to measure to what extent the two sets match, namely, to measure the size
of the unshaded area. Since the absolute size is not meaningful, it should
be normalized by calculating the proportional area. This value is the F-
measure:
2
·
(
True Positive
)
False Positive
+
False Negative
+2
·
(
True Positve
)
=
F
.
(4.7)
Proportion of unshaded area =
The F-measure can have values between 0 to 1. It obtains its highest
value when the two sets presented in Figure 4.2 are identical and it obtains
its lowest value when the two sets are mutually exclusive. Note that
each point on the precision-recall curve may have a different F-measure.
Furthermore, different classifiers have different precision-recall graphs.
4.2.5
Confusion Matrix
The confusion matrix is used as an indication of the properties of a
classification (discriminant) rule. It contains the number of elements that
have been correctly or incorrectly classified for each class. We can see on its
main diagonal the number of observations that have been correctly classified


Search WWH ::

Custom Search