Java Reference
In-Depth Information
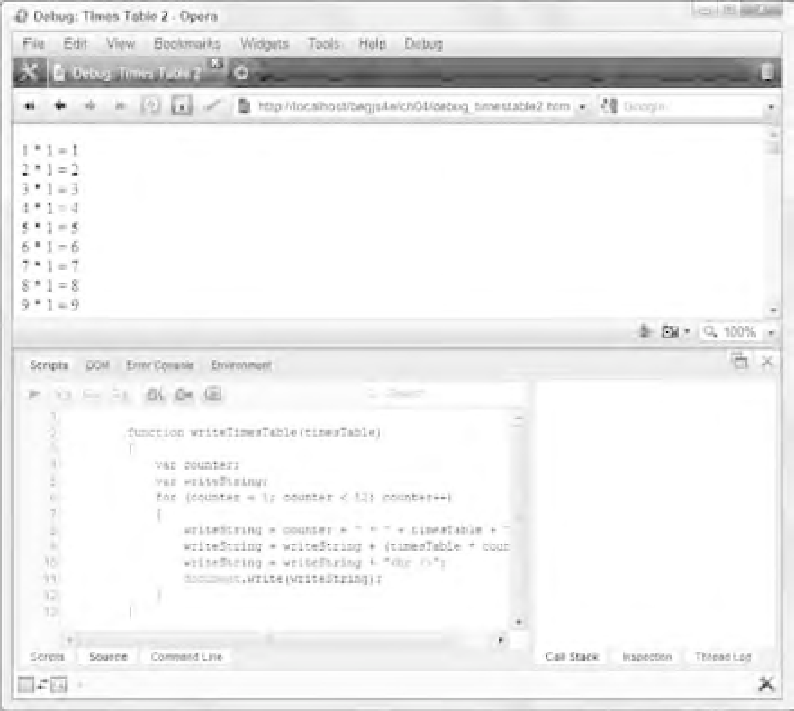
Figure 4-32
Go back to the Scripts tab (at the bottom of the window), and you'll see a pair of square brackets
(
[]
) surrounding the inline script you clicked. This denotes the script that is currently displayed
in the Source tab. Click the second inline script to view the contents of the
<script />
element
in the HTML document's body.
❑
Command Line:
This is Dragonfl y's console. Like the consoles of Firebug, IE8's Developer Tools,
and Safari's Web Inspector, this console allows you to check variables' values and execute
JavaScript commands within the context of the currently paused line.
The right panel contains the Call Stack, Inspection, and Thread Log tabs:
❑
Call Stack:
Displays the call stack.
Inspection:
❑
Displays the variables and their values in scope at the paused line.
❑
Thread Log:
This is an advanced debugging tool that provides the information on the process-
ing and execution of JavaScript code. This section will not cover the Thread Log tab.