Java Reference
In-Depth Information
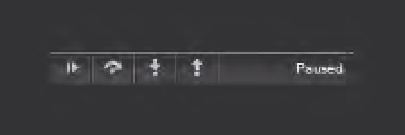
Stepping Through Code
The code-stepping buttons are at the top of the right panel and underneath the search box (see
Figure 4-30).
Continue
Step Into
Execution Status
Step Over
Step Out
Figure 4-30
These buttons perform the same functions as in Firebug and IE; however, they are in a slightly different
order. The fi rst button continues code execution until either the next breakpoint or the end of all code.
The second button is Step Over, the third is Step Into, and the fourth is Step Out.
Like Firefox and Firebug, Safari and Web Inspector update the page as you step through code. So you
can see the results as each line executes.
The Console
The console serves the same purpose as it does in the previous tools. You can check the value of a vari-
able by typing the variable and pressing the Enter key. You can also execute code in the context of the
current line of code. Try the “Changed on the Fly” example from the Firebug section to see it in action.
Unlike the previous tools, the Web Inspector console does not allow for multi-line input.
Although the Web Inspector's UI is sleek and tab-less (and some would say cluttered), it's time to ven-
ture back into the world of tabs with Opera's Dragonfl y.
Using Dragonfl y: Opera's Development Tools
Opera's Dragonfl y is a latecomer to the realm of browser-based development tools. At the time of this
writing, it is currently pre-beta software, but it comes included with Opera as of version 9.5.
There are two ways to open Dragonfl y:
❑
Through the Tools menu: Tools
➪
Advanced
➪
Developer Tools.
❑
Through the Debug menu, which can be installed by opening the following URL in Opera:
http://dragonfly.opera.com/app/debugmenu/DebugMenu.ini.
Figure 4-31 shows Dragonfl y open with debug_timestable2.htm loaded in Opera.