Java Reference
In-Depth Information
The Continue option (shortcut key F5) continues code execution until either the next breakpoint or the
end of all code. The second option, Break All, ensures that the debugger breaks before the execution of
the next statement. Break on Error tells the debugger to break whenever an error occurs. Step Into (F11),
Step Over (F10), and Step Out (Shift+11) behave as they do in Firebug.
IE8's debugger denotes the current line by highlighting the line in yellow and adds a yellow arrow in
the gutter.
Unlike Firefox and Firebug, stepping through code does not update the web page. The JavaScript exe-
cutes, but you will not see the results until all code is executed.
The Console
Unlike Firebug's console, IE8's Developer Tools console is located with the rest of the JavaScript tools
and is accessed via the Console tab, but that's where the primary differences end.
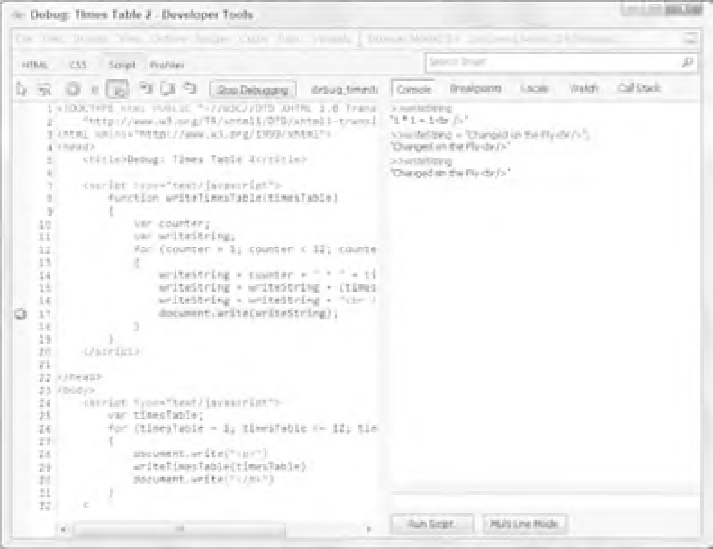
The console logs JavaScript errors and allows you to execute code within the context of the line the
debugger is stopped at. Figure 4-23 shows the “Changed on the Fly” example from the Firebug section
recreated in IE8.
By default, the console accepts only single lines of JavaScript code. You can change this by clicking the
Multi Line Mode button.
Figure 4-23