Java Reference
In-Depth Information
Keeping the corrected debug_timestable.htm loaded in Firefox, create a breakpoint on line 14.
writeString = writeString + (timesTable * counter);
Reload the page, and notice Firebug stopped code execution at the breakpoint you just created. Firebug
highlights the current line of code in light yellow and puts a yellow arrow in the gutter. This line hasn't
been executed yet.
Click the Breakpoints tab in the right panel; it shows you the list of breakpoints (only one in this case).
Each entry in the list consists of a checkbox to enable/disable the breakpoint, the containing function's
name, the fi le name and line number of the source fi le, the source text of the breakpoint, and a Delete
button.
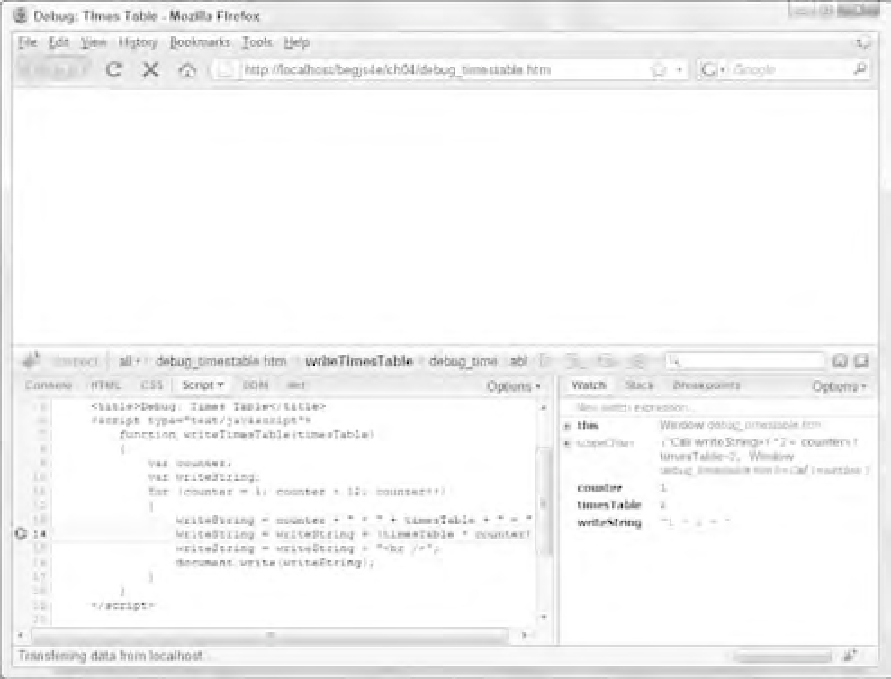
Now click the Watch tab.
Watches
The Watch tab displays variables and their values currently in scope at the current line while code exe-
cution is paused. Figure 4-6 shows the contents of the Watch tab at this breakpoint.
Figure 4-6
Notice that the
counter
,
timesTable
, and
writeString
variables are visible (as is
this
).