Biology Reference
In-Depth Information
FIGURE 12.20
The model with the lowest devi-
ance, obtained by covariance model selection.
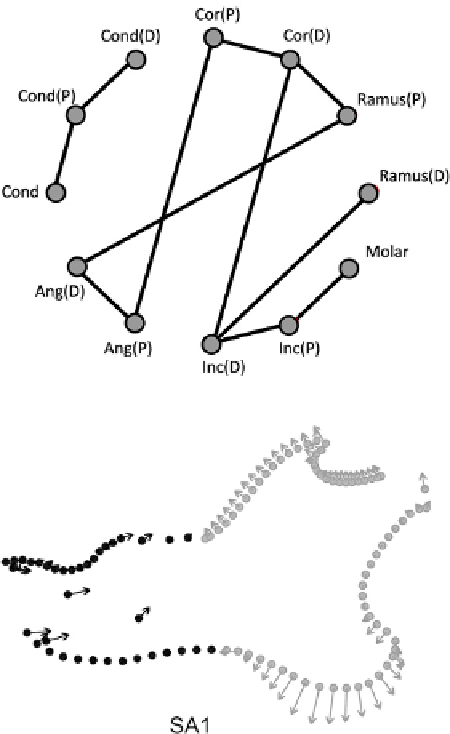
FIGURE 12.21
Two-block within-configuration
Partial Least Squares Analysis. Shown is the dominant
axis of covariation between the two blocks, Singular
Axis 1, which accounts for 46.6% of the covariance
between the front and back of the mandible.
What Do We Do Next to Interpret These Results?
Some results are consistent across methods but others suggest that we need to consider
additional models. A consistent result is that the Condensation model fits better than the
Front/Back model, and two of the three methods find more support for it than for
Satb2
Gsc model, which is more highly supported than the
Satb2
model. But the explor-
atory results suggest that none of the developmental models predicts the variational archi-
tecture of the mandible. One obvious question is whether support for the unexpected
patterns seen in the exploratory results can be seen in the covariances of landmarks. In
particular, is there any support for the hypothesis of integration between distal incisor
alveolus and distal coronoid process? We could begin to answer that question by returning
to PLS, using the within-configuration method to look at the relationship between the front
and back (
Figure 12.21
). In that figure, we do see support for the covariance between distal
incisor alveolus, coronoid and angular processes, and perhaps also the molar alveolus. We
could pursue this further by finer subdivisions of the data, isolating the landmarks of the
1