Biology Reference
In-Depth Information
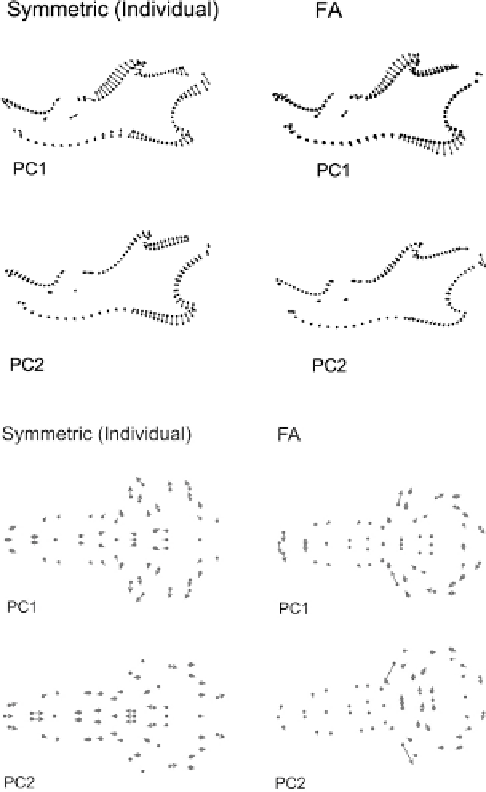
second approach, calculating the correlation between the covariance matrices for the FA
and symmetric (among-individual) components of variation. The resemblance between
these two covariance matrices can be examined visually by looking at each one's dominant
dimensions of variation. The first two principal components for the mandible variation
and FA are shown in
Figure 12.9
. When the diagonal is included, so that the variances as
well as covariances are included in the analysis, the correlation is fairly high, 0.694, drop-
ping very slightly to 0.643 when the diagonal is excluded. Not surprisingly, both correla-
tions are statistically significant,
p
0.001. In the case of the cranium, whose first two PCs
are shown in
Figure 12.10
, the correlation between the two matrices is also fairly high,
0.586, and statistically significant (
p
,
0.001) when the diagonal is included, but the corre-
lation drops to a very low 0.038, which is not statistically significant (
p
,
0.61) when the
5
diagonal is excluded.
FIGURE 12.9
Comparing patterns of sym-
metric and fluctuating asymmetric covariation.
First two principal components of symmetric
variation (among individuals) and fluctuating
asymmetry of the prairie deer mouse cranium.
FIGURE 12.10
Comparing patterns of sym-
metric and fluctuating asymmetric covariation.
First two principal components of symmetric
variation (among individuals) and fluctuating
asymmetry of the prairie deer mandible.