Biology Reference
In-Depth Information
we would not further consider it. The one that fits best is the monomolecular (
Equation
11.10
above). So we can use the estimated values for K, A and t
0
to predict D at any age.
We can also determine relative maturity by dividing the value of D at each age by A
(which is the value of D at 100% of maturity). For the comparison between house mouse
and cotton rat, we can then assess their degree of maturity at several life-history mile-
stones (
Figure 11.25
).
DISPARITY OF ONTOGENY
As well as analyzing the disparity of shape, we can also analyze the disparity of the
ontogenetic trajectories. We do this by computing the vector of allometric coefficients for
each species; each vector is then entered as a row in the data matrix, i.e. the first column
of the data matrix is the allometric coefficient for the first shape variable, e.g. the x-coordi-
nate of landmark 1, or the x-component of partial warp 1 and the second column is the
allometric coefficient for the next variable, etc. The second row contains the allometric vec-
tor for the next species and so forth. Recall that correlation between the vectors is the sum
of
the products of
the corresponding coefficients;
the patterns of variation among
FIGURE 11.25
The degree of maturity
shape (measured as the proportion of the
asymptotic adult value attained at each age)
against life-history milestones for the house
mouse and cotton rat.
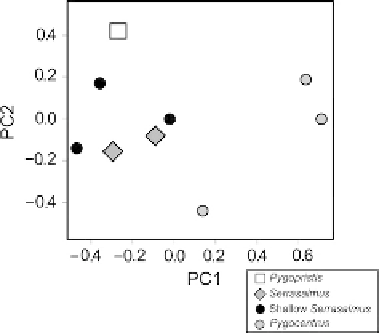
FIGURE 11.26
Allometric disparity: principal compo-
nents of variation of ontogenetic trajectories.