Biology Reference
In-Depth Information
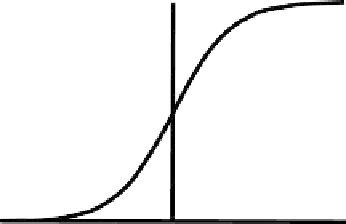
FIGURE 11.24
A sigmodial (logistic) growth curve.
An alternative method for analyzing rates of growth and development is to use non-
linear models, which have been widely applied to studies of growth. One class of models
is called “sigmoidal” because the curve is S-shaped (
Figure 11.24
). There are several
growth models, including the monomolecular (
Gaillard et al., 1997
), von Bertalanffy and
Gompertz ((
Zullinger et al., 1884
) and Fiorello and German (
Fiorello and German, 1997
).
Relative fit of competing models can be assessed by the Aikake Information Criterion
(AIC) which is a function of the log-likelihood of the parameters given the data and the
number of parameters in the model (
Akaike, 1974
). The AIC is calculated as:
AIC
5
2k
2
2ln
ð
likelihood
ÞÞ
(11.8)
where k is the number of parameters in the model. The number of parameters is important
because simple models will generally have lower likelihoods than more complex ones.
The AIC effectively balances likelihood with model complexity, although the derivation of the
AIC is based on information measures rather than a concept of balancing. To compare models,
wecancomputethedifferenceintheirAIC(
AIC) or estimate the AIC weight. AIC weight is
an estimate of the relative probability that a particular model is true, and is computed as:
Δ
AIC Weight
exp
ð
2
0
:
5
Δ
AIC
Þ
(11.9)
5
Δ
So if we have two models, one with an AIC of
2
4 and another with an AIC of
2
2,
AIC
for the second model is
0.5 * 2) or
0.368, meaning that it is 0.368 as likely as the first. But whether the best fitting model fits
well is also important because we would not want to choose the best of several poorly fit-
ting models. Additionally, we would not pick a model that yields significant serial autocor-
relations between residuals from the model even if it has the highest AIC weight. Although
the data from growth series are serially autocorrelated, the residuals from the model should
not be. Correlated residuals mean that the data violate the assumptions of the model
2
(
4)
2, and the AIC weight of that model is exp(
2
2
2
5
2
there
is a mismatch between data and model. Thus, to decide if any model fits well, we can first
look at the variance explained, then at the serial autocorrelation of residuals, and then, look-
ing only at the models that have not been ruled out due to significant autocorrelation of resi-
duals, we can choose the one that has the lowest AIC (or, equivalently, highest AIC weight).
Having chosen the model, and estimated its parameters, we can then predict Procrustes
distance at any developmental age. For example, the monomolecular model is:
e
k
ð
t
0
2
t
Þ
g
D
ð
t
Þ
5
A
f
1
2
(11.10)