Biology Reference
In-Depth Information
to the coefficients obtained from traditional morphometric data, those obtained from geo-
metric shape data are not interpretable one by one. Another notable difference is the abil-
ity of geometric analyses to synthesize all the data (including all interlandmark distances
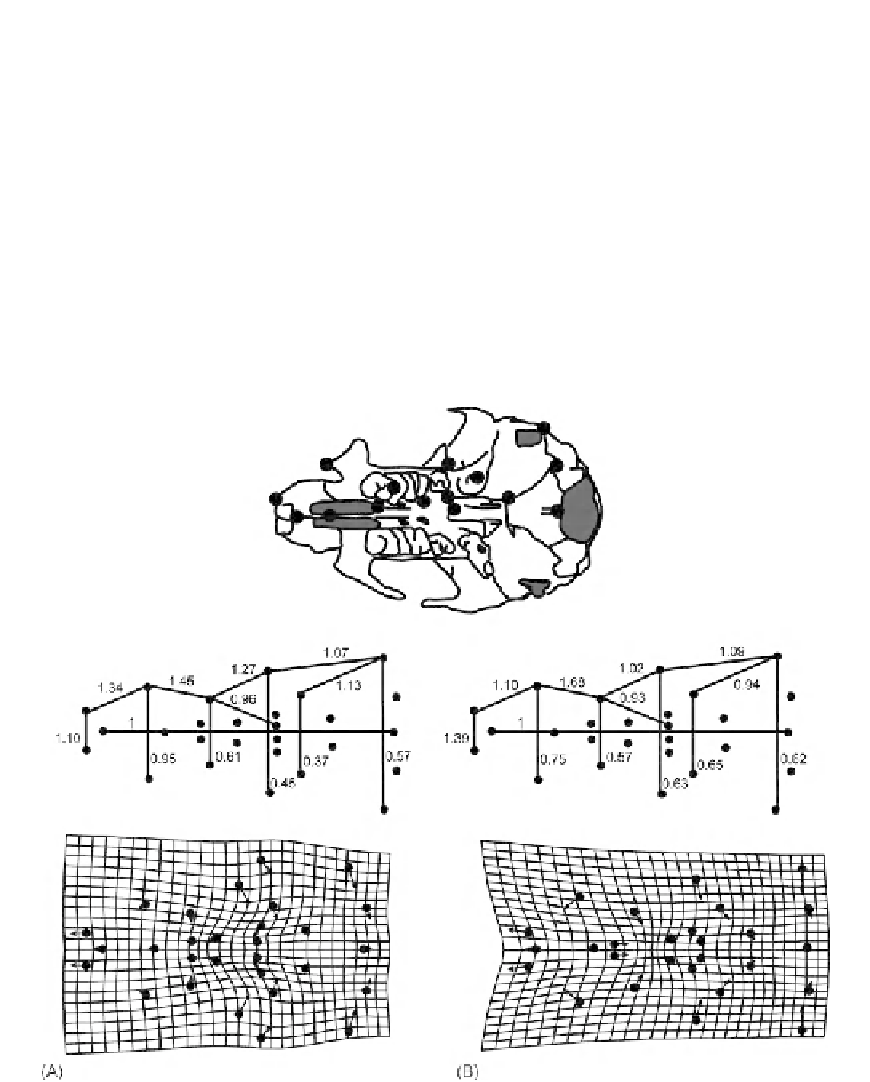
that were not measured). We can best appreciate that difference by comparing two pic-
tures, one showing the allometric coefficients drawn on the skulls and the other showing
the deformed grids depicting the ontogenetic change in skull shape (
Figure 11.9
). What we
can see more readily from the grids are the striking changes in palatal proportions medi-
ally versus more laterally.
Another notable difference is that geometric data yields more interpretable results in
comparative studies. We first present a series of hypotheses about the evolution of ontog-
eny, and then discuss how to test them.
FIGURE 11.9
Allometric coefficients of the two rodent skulls; (A) cotton rat; (B) house mouse. Coefficients
higher than 1.0 indicate positive allometry; coefficients lower than 1.0 indicate negative allometry; and coefficients
near 1.0 indicate isometry.