Biology Reference
In-Depth Information
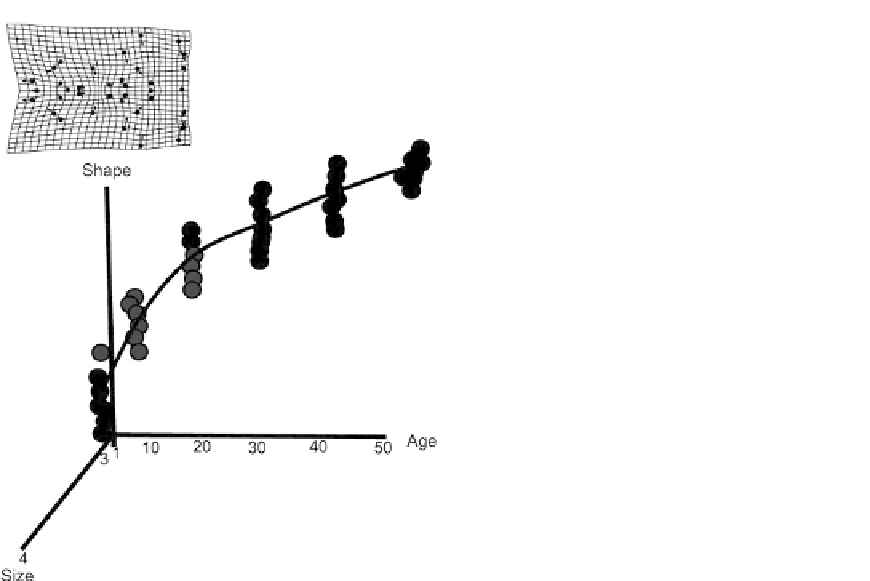
FIGURE 11.3
The ontogenetic trajectory of a cotton
rat, Sigmodon fulviventer.
shape as it changed direction from age to age. If we try to compare two species, the
diagrams become even more complicated because we would then have two (curving) tra-
jectories and we would need to represent the geometrical relationships of these curves
within and between the trajectories. Projections of two or more complex multidimensional
ontogenetic trajectories can be misleading and distort those geometric relationships so we
cannot rely on the pictures to see by how much, or in what, two or more trajectories differ.
Fortunately, we do not use these projections to formulate or test hypotheses.
In this chapter, we discuss the range of hypotheses about the evolution of ontogenetic
trajectories that can be tested and how to test them. Some hypotheses cannot be tested
without information about chronological age. We emphasize “chronological” age because
of the contrast some authors have made between “chronological” and “biological” or
“developmental” age. This contrast has been central to some of the arguments about the
necessity for age data; one argument for that necessity is that information about age is
needed for process-oriented studies
it is growth relative to time that provides the
information about process and therefore without age data, the analysis devolves into a
merely pattern-oriented study (
Blackstone, 1987
). One counterargument is that the mathe-
matical model for allometry is the solution of the differential equation for growth rates
relative to time (
Strauss, 1987
). A second is that chronological time does not have any
theoretical priority over other estimates of biological age, which includes size, for the
description of comparison of growth patterns (
Strauss, 1987
). The argument is not that size
is a proxy for chronological age but rather that size provides information about biological