Biology Reference
In-Depth Information
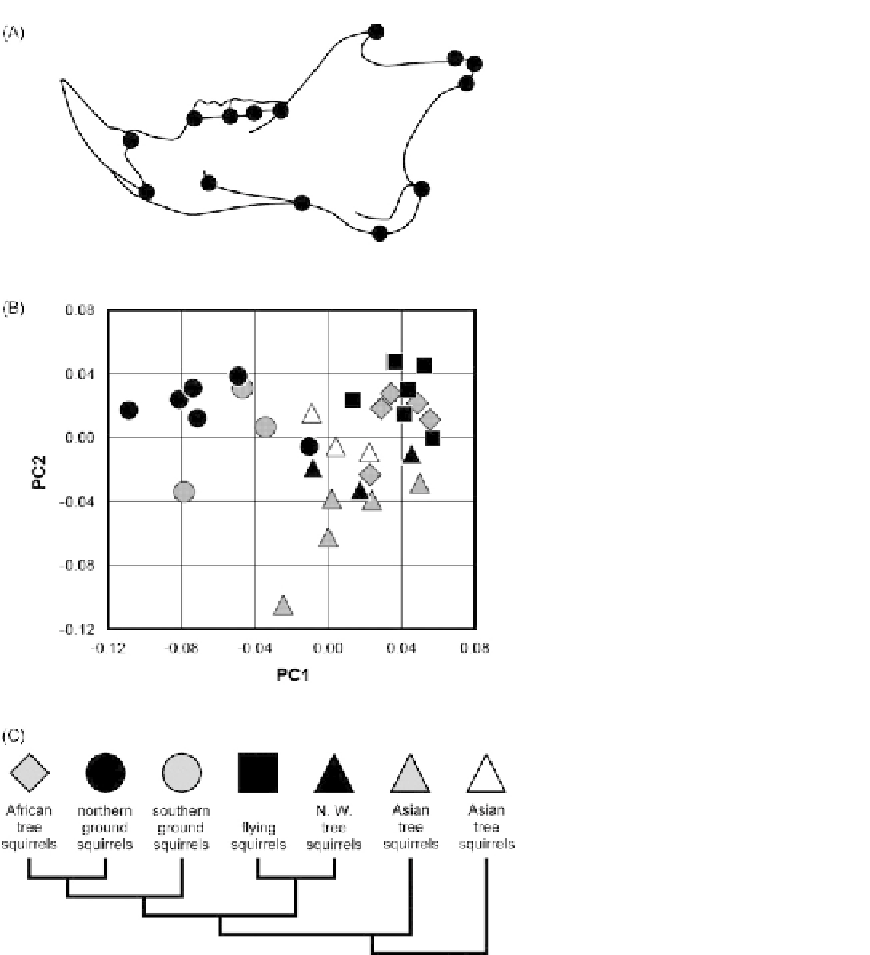
FIGURE 10.11
Cluster analyses of
squirrel mandibles, part I. (A) Landmarks
on representative
Sciurus
(North American
tree squirrel). (B) Scores on first two PCs;
symbols represent seven major monophy-
letic groups within the family, which are
geographically and ecologically distinct. (C)
Phylogenetic relationships of the clades,
based on
Mercer and Roth (2003)
.
group. It is broadly similar to UPGMA, in that some measure of within-group differences
is minimally increased at each step. Since average distances are related to variances,
UPGMA and Ward's method will tend to produce similar clusters, as shown in
Figure 10.12C
. In fact, in this example, the biggest difference between UPGMA and
Ward's dendrograms is the greater variety of levels at which groups are linked; there are
very few differences in group composition.