Biology Reference
In-Depth Information
0.2
6
1
2
3
4
0.1
5
7
8
9
0
14
15
13
-0.1
12
10
-0.2
11
(A)
-0.3
-0.2
-0.1
0
0.1
0.2
0.3
0.010
0.005
0.000
-0.005
-0.010
-0.020 -0.015 -0.010 -0.005
0.000 0.005
BCPC1-87%
0.010
0.015
0.020
00.025
(B)
(C)
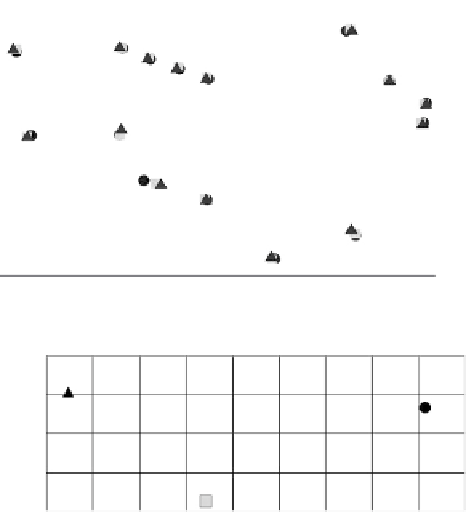
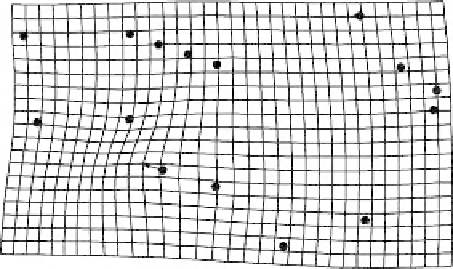
FIGURE 6.19
Differences in mean shape of squirrel jaws from the three geographic samples, analyzed by
BGPCA. (A) Mean shapes. (B) Scores. (C) Deformation showing the shape difference between means of the west-
ern and southern samples along BGPC1.
been the case if the samples were more distantly related or if they were collected from
more distinctive habitats.
BGPCA explicitly disregards the issue of discrimination, however, if one has an interest
in evaluating discrimination, or has other reasons for examining variation along these
axes, the scores of individuals on these axes can be obtained easily by multiplying the
data matrix (superimposed landmark coordinates) by the eigenvectors of the BGPCA. The