Biology Reference
In-Depth Information
melon, we could simply plot each melon's centroid; however, suppose we want to find
the direction in which it is easiest to walk across the field without stepping on any of the
melons (perhaps we want to spread fertilizer in the field). To solve this problem, we want
to find the direction in which the melons are farthest apart. This requires that we know
the averages of the shapes and orientations of all the melons, not just the position of each
melon's centroid.
Similarly, CVA begins with a PCA of the pooled (averaged) within-group variances.
This gives us a new coordinate system in which we can describe the position of each
group. In our field, we begin by defining a new coordinate system that would be aligned
with the axes of the average melon (
Figure 6.11
).
Now we can see that the melons overlap more in the direction defined by the long axis
of the average melon. To take this into account, we rescale this axis proportionate to the
elongation of the average melon. In effect, we distort our plot of the field until the average
melon looks circular rather than elliptical (
Figure 6.12
).
Now we can solve for the direction in which melons tend to be farthest apart in the
rescaled space by performing a PCA on the group centroids. The axes produced by this
last computation are the CVs (
Figure 6.13A
). The scores of individuals on the CVs are the
projections of the individuals onto these new coordinate axes (
Figure 6.13B
).
Because computation of the CVs involves a rescaling, interpretation of CV scores can be
complex. If we undo the rescaling and rotation that were used to solve for the CVs
(
Figure 6.14
), we see that each CV is a linear combination of the original variables.
However, we also see that the CVs are not orthogonal axes in the original coordinate
space. Furthermore, distances on CVs are not equivalent to distances in the original space.
Note that, in this example, there are more groups than variables in the original data set.
In such cases, the number of CVs will be equal to the number of variables. Most studies
will have fewer groups than variables and, in these cases, the number of CVs will be one
less than the number of groups. If there are three groups in a study, the differences among
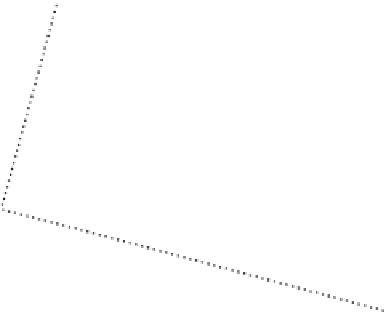
FIGURE 6.11
Graphical representation of
the first step of CVA. The entire data set is
rotated to a new coordinate system that is
aligned with the PCs of the pooled variances.
At this stage the relative positions of the four
samples (and the individuals within groups)
have not changed. The original coordinate sys-
tem (
Figure 6.10
) is shown in the dotted lines.
The axes of the new coordinate system are
labeled in parentheses because we have not
specified the location of the average sample,
only the directions of its variances.
X
2
X
1
(PC1)