Biology Reference
In-Depth Information
evaluates whether variation in the last
R
eigenvectors is spherical. To test two successive
eigenvalues,
R
is set to 2. For the squirrel jaw example, comparison of the first two eigen-
values yields
2
19.12, which has a
p
-value less than 0.0001. Comparison of the second
and third eigenvalues yields
χ
5
2
0.55, which has a
p
-value of 0.76. Thus, PC1 is the only
one with a distinct eigenvalue, and the only one that can be regarded as biologically
meaningful.
If you use several software packages to run PCAs, you may occasionally find the
results differ in signs for the PCs (when that happens, the scores for individuals on those
axes also differ by a sign). Reversed axes and scores can be disconcerting, but there is
no need to worry
χ
5
the sign of a PC is arbitrary. If
A
1
is an eigenvector corresponding
to
2
A
1
. If we change the sign on
A
1
, then the score of the
j
th specimen on
the first axis will also change sign;
Y
j
5
A
1
X
j
λ
1
, then so is
so the product
Y
1
A
1
does not change
sign. In other words, the eigenvectors
A
1
and
2
A
1
are simply mirror images. The choice
of sign has no effect on the interpretations of this component, and no effect on the com-
putation of the subsequent component (a vector orthogonal to
A
1
will also be orthogonal
to
2
A
1
).
To this point we have not discussed how to interpret the pattern of variation repre-
sented by a PC. That rests on the coefficients of the PC, which express the relationship
between the PC and the original variables. Because our original variables are shape vari-
ables, we can generate a picture of shape variation along any PC by multiplying the
original shape variables by the coefficients of the PC and summing them.
Figure 6.9
shows the result of that computation for PC1 of shape variation in the sample of squirrel
jaws.
We should note that many of the studies applying PCA to geometric data call the method
“relative warps analysis” (RWA). PCA and RWA are not exactly equivalent, because the
components of variance extracted by RWA are sometimes weighted by bending energy
(originally, RWA was an analysis of components of variation relative to bending energy,
hence the term “relative” in the name of the method). When variation is not weighted by
bending energy, RWA is PCA. We prefer the more familiar term.
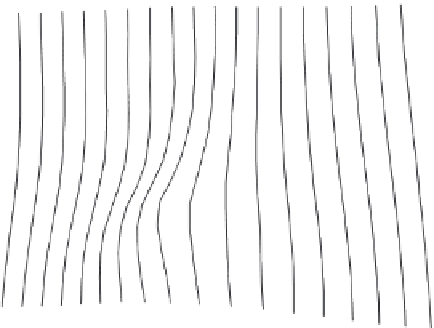
FIGURE 6.9
Pattern of shape change
along PC1 for the 31 squirrel jaws shown in
Figure 6.6
. Circles indicate the locations of
the landmarks in the mean shape of the sam-
ple; arrows indicate the changes in the rela-
tive positions of the landmarks as the score
on PC1 increases. The deformed grid illus-
trates the thin-plate spline interpolation over
the entire form.