Environmental Engineering Reference
In-Depth Information
3000
2000
1000
0
0
500
1000
1500
2000
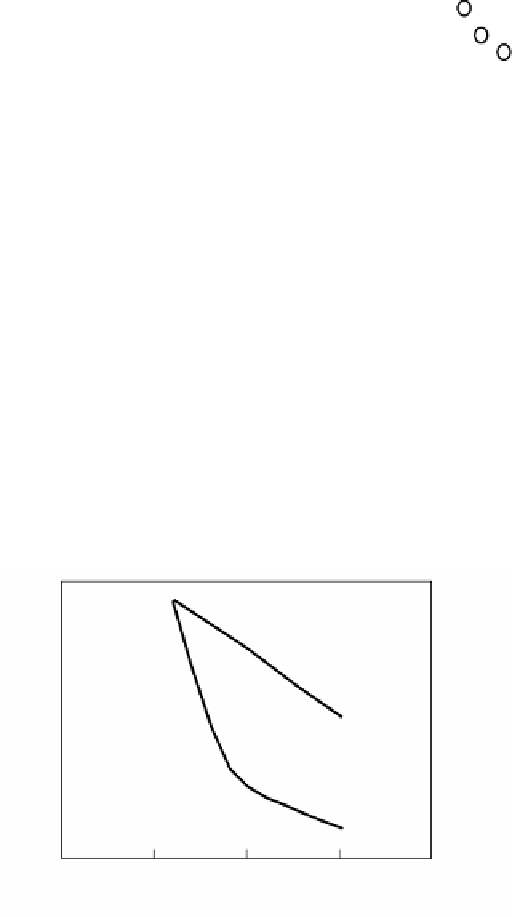
Preheating temperature, K
FIGURE 2.47
NO concentration in preheated flames with α = 0.2095.
varied to obtain flames with those values for the adiabatic flame temperature and
T
0
> 298 K. For example, for
T
a
= 1600 K, α ≤ 0.13; for
T
a
= 1800 K, α ≤ 0.15.
2.3.2.2.3 Fuel Flux
Figure 2.48
shows the variation of burning velocity with α and air preheat temper-
ature for
T
a
< 2200 K. The burning velocity for α = 0.15 is 1/9 of the value for α
= 0.06. From the figure, self-ignition can be thought to occur for conditions where
α ≤ 0.09.
The variation of the fuel flux is similar to that of the burning velocity: from 5.42
× 10
-4
mol/cm
2
·s for α = 0.06 to 2.93 × 10
-4
mol/cm
2
·s for α = 0.15. The fuel flux
is the product of the concentration of methane in the unburned mixture and the
30
2000
1500
20
1000
10
500
0
0
0
0.05
0.10
0.15
0.20
Oxygen ratio
FIGURE 2.48
Burning velocity and preheating temperature of flames with
T
a
= 2200 K.


Search WWH ::

Custom Search