Environmental Engineering Reference
In-Depth Information
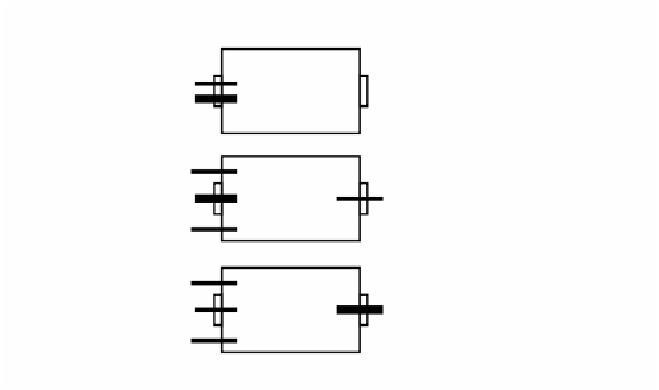
Firing Description
Side 'A' Firing
Side 'B' Firing
F1
F1
Mode I
Fuel/Air Mixed Flow
E
E
A
A
A side
B side
A side
B side
F2
F2
Mode II
Fuel/Air parallel Flow
A
E
E
A
F2
F2
F2
F2
Mode III
Fuel/Air counter Flow
E
E
A
A
F2
F2
F: Fuel injection , A: Preheated combustion air, E: Cold exhaust gas
Fuel-air nozzle confi
gurations.
Temperature, C
Temperature, C
Temperature, C
1200
1200
1200
1100
1100
1100
1000
1000
1000
900
900
900
3.8
3.8
3.8
2.85
2.85
2.85
1.9
1.9
1.9
L/W
L/W
0
L/W
0
0
0.95
0.95
0.95
0.0
0.0
0.0
0.5
0.5
0.5
0.5
0.5
0.5
W
W
W
(a) Mode I
(b) Mode II
(c) Mode III
Fuel/Air mixed flow
Fuel/Air parallel flow
Fuel/Air counter flow
FIGURE 2.10
Temperature distribution averaged over one switching cycle in 350 kW-scale
test rig.
and CO emissions for Mode I were 213 and 16 ppm, respecti
vely, at 11% O
2
correction, whereas the
y were both 15 ppm in Mode II. In Mode III, NO
and CO
x
emission levels were 13 and 17 ppm, respectively, which is very similar to the Mode
II performance.
In these combustion tests, the average temperature of the preheated air reached
1150˚C when the average flue gas temperature was 1250˚C in the test rig. This
temperature was obtained by using the high-cycle switched regenerator with 30 s
switching time. The air side temperature efficiency for this condition was 91%, and
the efficiency of the waste heat recovery was 77%. These results demonstrated that
significant energy saving can be attained by introducing the high-cycle regenerator.


Search WWH ::

Custom Search