Environmental Engineering Reference
In-Depth Information
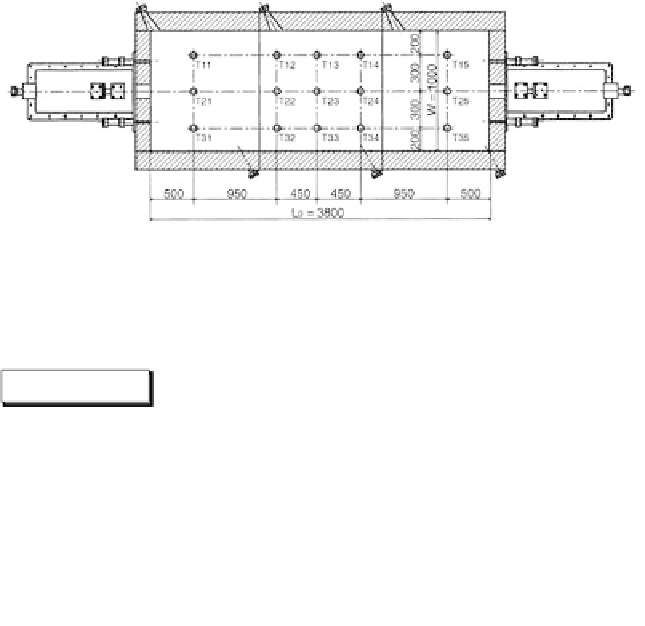
Locations of thermocouples for temperature distrib
ution measurement.
Exhaust
Fuel flow
Computer
Image processing unit
Computer
CCD camera
Light
sheet
Computer
Interface
Optics
Laser head
Camera control unit
Computer
Fuel flow
Air flow
FIGURE 2.8
Schematic of cold fl
ow model test.
2.2.2.3
Temperature Profiles
Three dif
ferent fuel-air nozzle configurations shown in
Figure 2.9
have been exam-
ined. Mode I represents an arrangement for ordinary combustion in which the mixing
of fuel with air occurs in the air nozzle or near to the air throat. Mode II is a parallel
flow type of arrangement for high temperature combustion in which fuel-air prep-
aration and dilution processes with the products of internal combustion occur through
the use of high-velocity turbulent airflow that creates a natural entrainment effect
to the airflow. Mode III also represents an arrangement for the high temperature
combustion process but with a counter flow type of arrangement. This arrangement
is intended to enhance mixing of the fuel-air dilution process in the test furnace.
Temperature profiles averaged over one switching cycle were measured, and
results for the three modes are shown in
Figure 2.10
.
The maximum temperature
difference in Mode I was 120˚C and this temperature difference decreased to 80˚C
in Mode II. The minimum temperature difference of 20˚C was obtained in Mode
III, which suggests that high temperature and low oxygen concentration combustion
occurred not only in the designed 1.3-kW scale test facility but also in the 350-kW
scale test rig under the arrangements of Mode II and Mode III. In addition, NO
x


Search WWH ::

Custom Search