Environmental Engineering Reference
In-Depth Information
As shown in the figure, the latest high-temperature region disappears rapidly
due to radiation and convection heat transfer. Nevertheless, since the burned gas
flow does not change so quickly, we observe that the starting jet flow on the ignition
side is pushed back by the remaining inertia of the opposing jet flow. For this reason,
a high temperature region is formed in the near-field of the burner in the early period
of the start-up, and therefore the possibility of generating NO
x
is high.
The present result, not shown here, indicates that there is no problem if the
burner is ignited after the air stream has been ejected without fuel for about 3 s.
However, this air-ejection period is required to be as short as possible because the
heating capability is in proportion to the burning period. As for the optimum ignition
time, a delayed ignition by 1 s is considered most favorable. During this ignition
time the flow of jet flame switches from one burner to the other. The optimum
ignition time depends on the dimensions of the burner and furnace.
3.4.2.5 Comparison with Measured Temperatures by Suction
Pyrometer
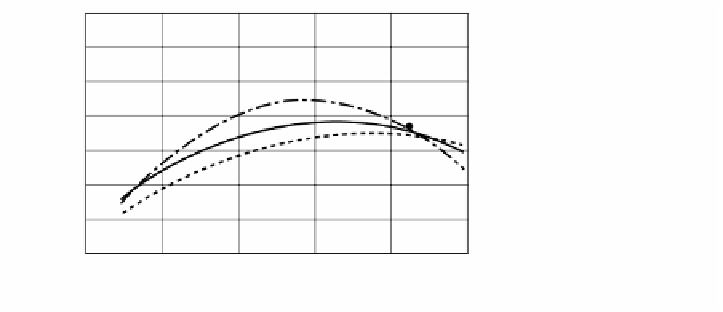
In the discussion so far, values that fit with heat flux values obtained in a prototype
furnace were used. Since burned gas temperatures were made available by mea-
surements obtained by suction pyrometers, we compared the values measured with
the pyrometer and the calculated values. We adopted measurements taken at 200
mm from each plane, i.e., the ceiling, floor, and sidewalls, which are considered
located away from the combustion regions. In addition, for calculated values, time
averages taken from several points because they greatly fluctuate in time and space.
As seen in
Figure 3.20
,
the calculated temperatures agree well with the measured
temperatures near the sidewall regions, but the former are estimated slightly below
the measured ones near the floor area indicating better needs for the model used.
The radiative heat transfer to the water pipe for heat removal is considered to be
overestimated.
1700
1600
Around ceiling
Around bottom
Around walls
Calculated values (bottom)
Calculated values (sidewalls)
Calculated values (ceiling)
1500
1400
1300
1200
1100
1000
0
2
4
6
8
10
Distance from Waste Gas Suction Hole (m)
FIGURE 3.20
Comparison of experimental and calculated average temperatures.


Search WWH ::

Custom Search