Environmental Engineering Reference
In-Depth Information
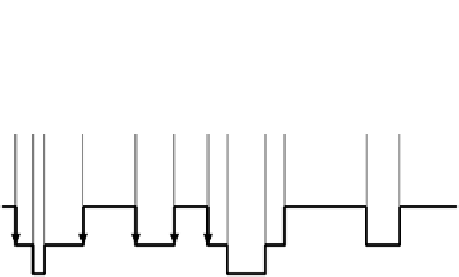
k
3
Absorption band
Representation
k
2
k
(=0)
1
Wavenumber
ω
a
g,1
a
g,2
a
g,3
Wavenumber region where each absorption
coefficient applies
FIGURE 3.12
Representation of real gas absorption band.
in
Figure 3.11
.
These models are known as wideband models. Edwards and Bal-
akrishnan proposed a model called exponential wideband model (EWBM),
17
in
which they assumed three types of line intensity distribution, since it is known from
quantum mechanics that the line intensity decreases exponentially in the band wings.
The absorption coefficient
S
/
d
is represented by one of the following three functions
(as illustrated in
Figure 3.14
):
Electronic transition
Vibrational transition
Vibrational-rotational transition
Rotational transition
1
µ
m
10
µ
m
Wavelength,
λ µ
m
FIGURE 3.13
Spectral lines due to electronic, vibrational, and rotational energy changes in
a gas molecule.


Search WWH ::

Custom Search