Environmental Engineering Reference
In-Depth Information
to take place in large furnace volume. To compare the previous trials with the
HTAC99 in the following figures the results of the HFO flame are reported together
with the gas composition profile in the coal flame.
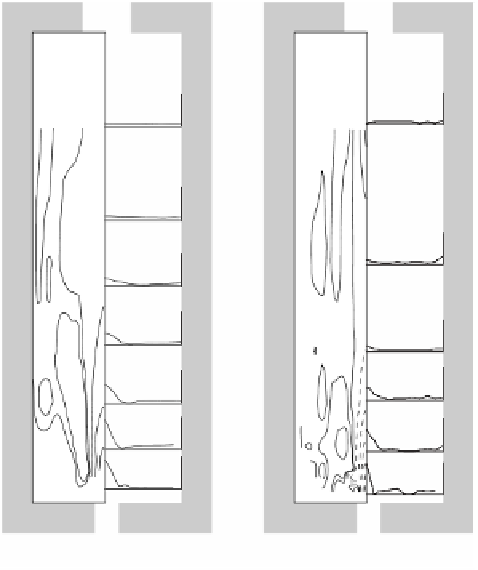
on the left side and in the HFO flame on the right side. The furnace is filled with
combustion products at 3% O
2
. Practically everywhere in the furnace this O
2
level
is measured. Only at the comburent inlet high O
2
concentrations are measured (up
to 23% vol. dry).
25
25
0
0
25
2
2
25
25
0
2
0
2
25
25
0
25
0
25
5
1.5
2
1
1.5
0
25
0
25
1
25
25
2
15
0
0
COAL Flame
HFO Flame
FIGURE 2.104
Oxygen concentration coal flame (Vol%, dry).
Carbon monoxide
—
Figure 2.105
shows the CO concentration in the furnace
for the coal flame and HFO flame. It reported the 5000 ppm contour line that may
be considered the flame boundary. On the fourth traverse (133 cm from the front
wall) high CO concentrations were measured; in the fifth traverse (205 cm) CO
up to 3000 ppm was measured. From these measurements, a flame length of almost
2 m can be estimated. This flame length matches with the “visible flame” length;
a clear flame was present until the fourth segment (205 cm). Carbon monoxide
emissions were below 50 ppm at the chimney. The HFO flame shows a similar
flame length. However, on the first traverse a second peak in the CO concentration
was measured (on the oil jet boundary at the wall side). The NG and LFO flames
had a clearly different CO profile. High CO concentrations were measured farther
downstream in the furnace and both NG and LFO flames seemed to have a much


Search WWH ::

Custom Search