Environmental Engineering Reference
In-Depth Information
3000
2500
O = 21%
2
O = 21%
2
2500
2000
10%
2000
1500
1500
1000
5%
1000
10%
T = 300K
fuel
500
500
5%
0
0
0
0
10
20
30
40
10
20
30
40
X , mm
X, mm
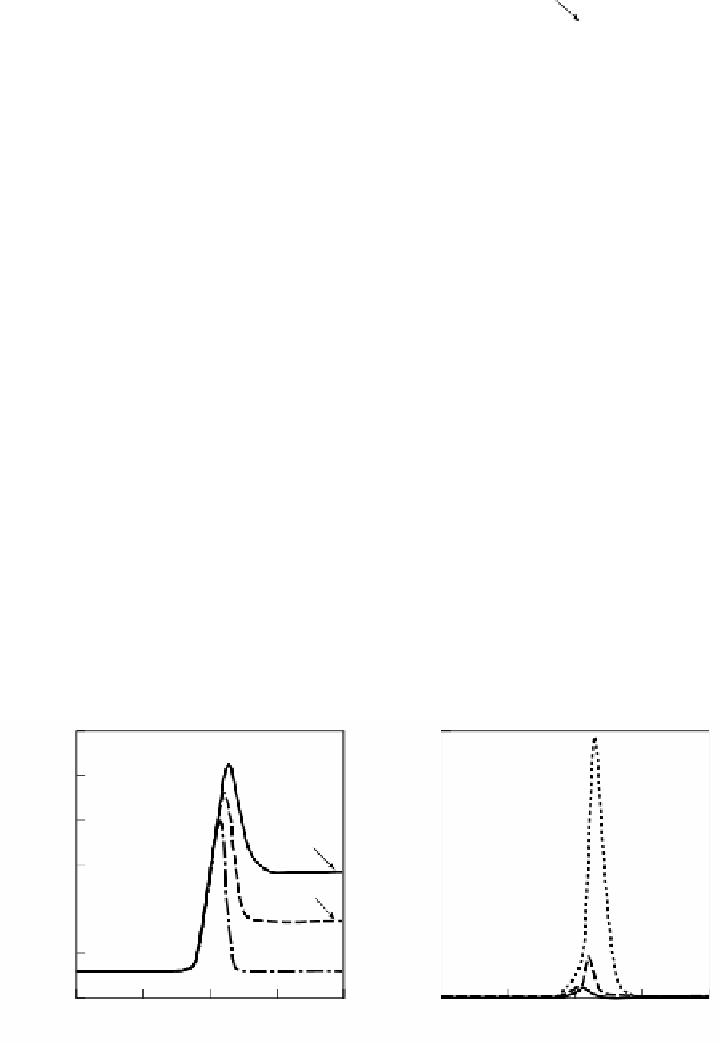
FIGURE 2.62
Distributions of temperature and NO in flat flames for various oxygen con-
centrations in diluted air.
Once considerable NO is formed by combustion with high temperature pure air,
the resultant combustion products may contain high concentrations of NO. There-
fore, combustion air diluted with burned gas may sometimes contain relatively high
concentrations of NO prior to combustion. It is actually predicted that the decom-
position rate of NO overcomes its formation rate for some cases. That is, when the
concentration of NO in the diluted air exceeds a certain level, noticeable reduction
of NO may occur in the flame as shown in
Figure 2.63
.
In spite of the possibility
of reduction of NO by hydrocarbons to a certain level, we cannot always expect
further reduction of NO when its concentration becomes relatively low.
2.3.5 P
OLLUTANT
F
ORMATION
AND
E
MISSION
Flames obtained by injection of fuel into a jet of preheated air are known to burn
with high efficiency and show low NO emission.
23,27-29
In a flame obtained by
3000
2500
T = 1400K
air
2500
2000
2000
T =
1400K
air
1500
1500
1000
850K
1000
T = 300K
fuel
500
300K
850K
500
300K
0
0
0
0
10
20
30
40
10
20
30
40
X mm
X mm
FIGURE 2.63
Distributions of temperature and NO in flat flames for various air preheat
temperatures.


Search WWH ::

Custom Search