Environmental Engineering Reference
In-Depth Information
fire proof cement
1x2
20
20
fuel
10
100x100
Nozzle 4
Nozzle 2
200x200
20
1
00x10
0
Nozzle 3
Nozzle 1
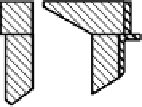
FIGURE 2.54
Combustion chamber used in the experiment.
the combustion rig was designed to demonstrate the different degrees of mixing
modeling the flows in the furnace, not the flows in the near-field of the burner. The
inlet of the combustion chamber of 300 mm length was once contracted and
expanded again so that the flow forms a recirculating flow inside the chamber. The
fuel used was natural gas and it was injected from one of four nozzles indicated in
the figure. The tip of the fuel nozzle, 1.5 mm in diameter, was fixed 10 mm away
from the heat insulator inside the wall for No. 1 and No. 2, and 30 mm for No. 3
and No. 4. The direction of fuel injection was 70˚, upward for No. 1 and No. 3 and
downward for No. 2 and No. 4, to the horizontal fuel tube. The fuel injection rate
was kept constant at 0.06
N
/s, and the feed rate of air was varied between 1.5 and
4.0
N
/s at the standard condition, and the temperature between 1450 and 1100 K.
The global excess air ratio (reciprocal of equivalence ratio) evaluated by the flow
rates of fuel and air varied between 2.27 and 6.25.
The variation of emission index of nitric oxides, combustion air temperature and
global excess air ratio is shown in
Figure 2.55
.
A significant change in nitric oxide
emission levels was observed by changing only the location of the fuel nozzle. For
fuel nozzle 3 the tendency of emission index in terms of global excess air ratio was
quite different from those for the cases of fuel nozzles 1 and 2. Further, for fuel
nozzle 4 the emission level was extremely low for any operating conditions and
seems independent of either global excess air ratio or combustion air temperature.
Since no unburned hydrocarbons were detected at the exit of exhaust for all cases,
the decreased nitric oxides emission should not be ascribed to imperfect combustion.


Search WWH ::

Custom Search