Databases Reference
In-Depth Information
Once the 32-bit MMC console has started with the Perfmon snap-in, the 32-bit SQL Server counters
should be available for addition to your log.
Combining System Monitor Logs and SQL
Profiler Traces
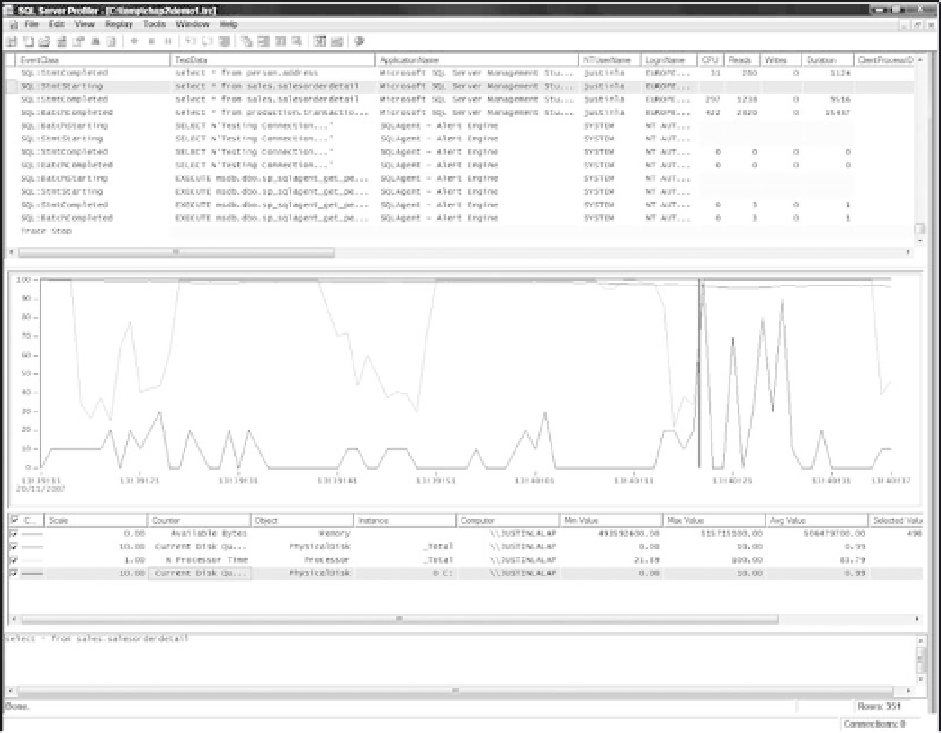
Analysis of performance data has been significantly improved in SQL Server 2005 with a feature allowing
the import of Performance Monitor log files into a SQL Profiler trace. The process is quite straightforward,
and necessitates both Perfmon and Profiler traces being captured to the file. There are more details in
the next chapter about how to achieve this (and there is more information about Perfmon in general in
Chapter 12). For now, suffice it to say it can make log and trace analysis significantly less cumbersome
as all data is presented in one application, mapped against a combined timeline. Figure 2-4 illustrates the
result of combining a SQL Profiler trace with a Perfmon log.
Figure 2-4
This level of data analysis and integration of performance data has never been seen before and sets
new standards for Microsoft applications integrating with Operating System performance tools. This
performance data integration means SQL Server DBAs will save many man-hours. You're much more


Search WWH ::

Custom Search