Databases Reference
In-Depth Information
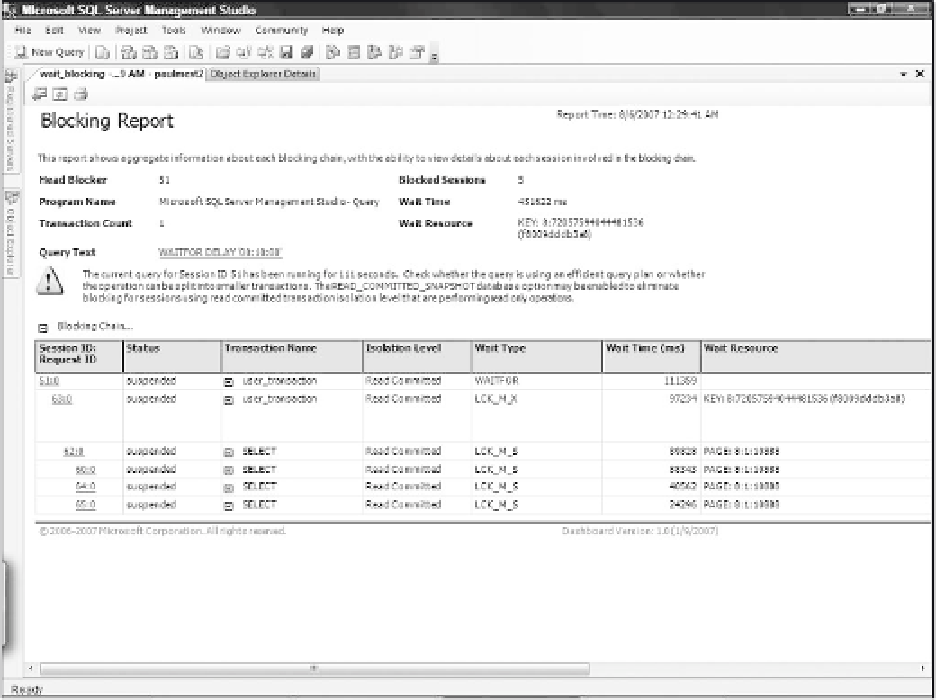
Figure 13-18
In the Blocking Report, you will see that session 51 is the
head blocker
. This is the session on which all
other sessions in this blocking tree are waiting. If you look at the Query Text you can see what the head
blocker is waiting on: WAITFOR DELAY '00:10:00'.
By expanding the blocking chain, you can see all of the sessions:
❑
Session 63 is waiting on 51.
❑
Session 62 is waiting on 63.
❑
Sessions 60, 64, 65 are waiting on 62.
To find out what statements are waiting, you can drill-through on one of the sessions to open the Session
Details report. Not only will this show you what statement is currently executing, it will show other
miscellaneous information about the session as well. The Session Details report lists all of the settings for
a specific session. It gives you the session ID, login name, login time, hostname, and program name to
help you identify what spawned the session. It also gives you aggregated information over the session's
lifetime. You can see the aggregate CPU time, reads, and writes. You can also see what requests are
executing in this session or what the last request was. If a request is currently executing, you can see the
query text as well as up-to-date statistics on the request. Finally, you can expand the View SET options
table to see useful settings like your ANSI settings and your Transaction Isolation Level.


Search WWH ::

Custom Search