Databases Reference
In-Depth Information
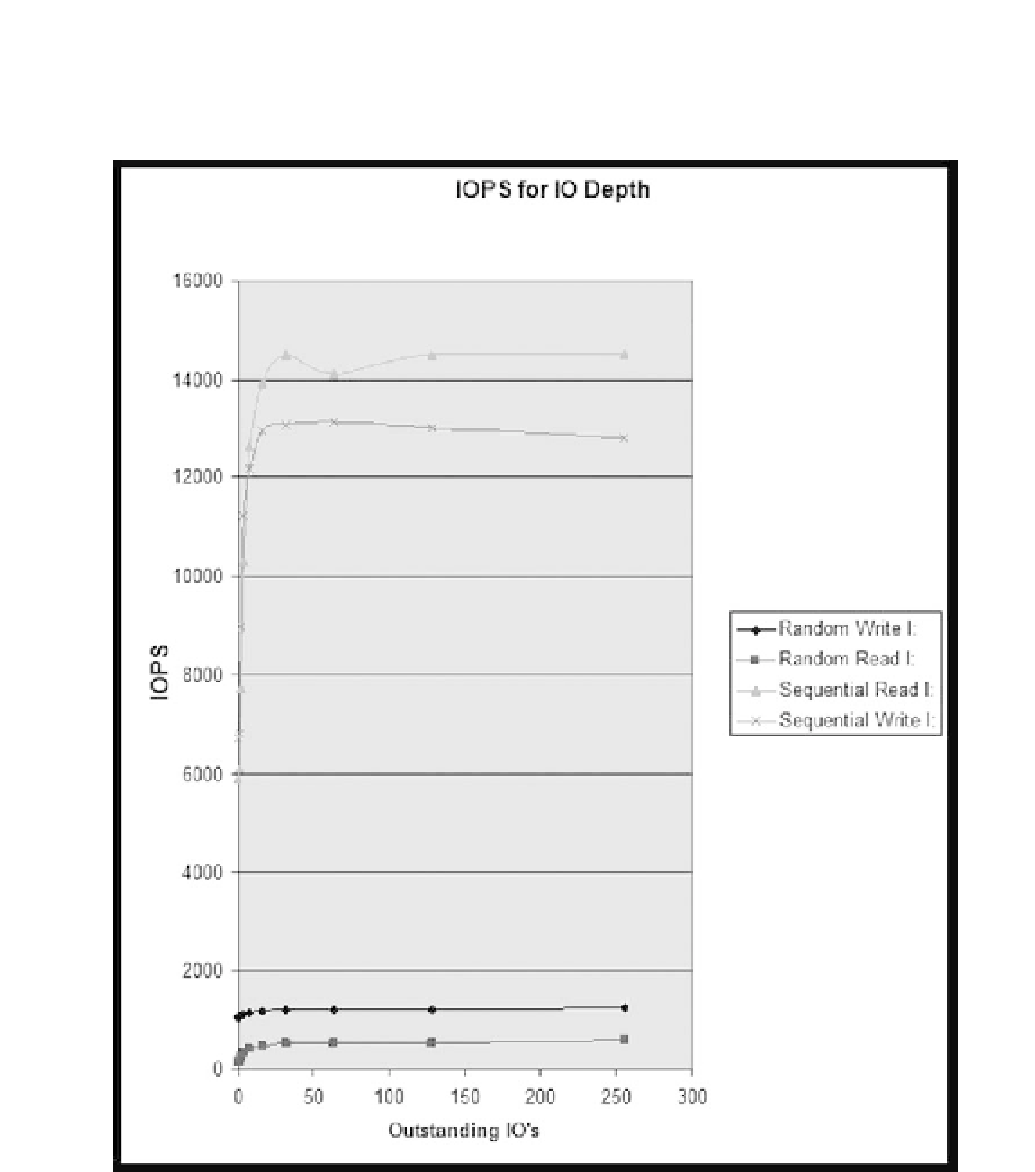
After running all four sets of tests, you can plot all 4 different I/O types on a single chart for that metric,
so the results will look similar to Figures 12-12 through 12-14. Figure 12-12 shows the throughput in
IOPS. Figure 12-13 shows the throughput in MB/Sec. Figure 12-14 shows the latency in mSec.
Figure 12-12
Now you have a much more complete picture of the overall performance of this particular disk subsystem
as you vary the number of outstanding I/Os.


Search WWH ::

Custom Search