Databases Reference
In-Depth Information
Figure 12-10
The chart shown in Figure 12-10 shows that the number of IOPS very quickly flattens out. The point you
are looking for on this chart is the knee in the plot (just before the plot starts to go horizontal, somewhere
about mid way between vertical and horizontal). In this case, that's about 1,180 IOPS, and from the X
axis that occurred at 16 Outstanding I/Os. It's a little hard to see exactly what the number of outstanding
I/Os was when you hit the knee as the scale is so small there. This is where you can go back to the raw
data, and once you know what you're looking for, it's easier to find the point in the data that you are
looking for.
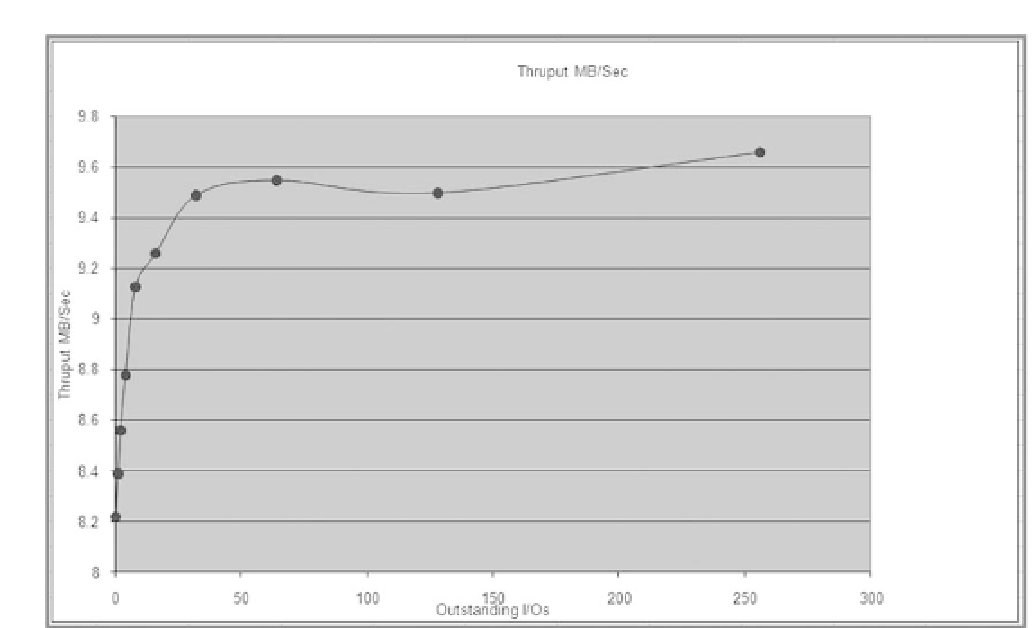
The chart in Figure 12-11 shows the throughput in MB/Sec. The point you are looking for again is the
knee point (where the plot turns from vertical over to horizontal). Somewhere in here is where you hit
the maximum realistic throughput, which coincides with the Peak IOPS and is the point at which latency
starts to exceed acceptable limits (10 mSec) In this case, the knee is around 9.3-9.5MB/Sec, and is actually
a little higher than the point at which the latency exceeded your limit of 10 mSec. In this case the peak
throughput occurred at about 9.5MB/Sec, although throughput continued to increase slowly, but only
as you experienced a completely unacceptable increase in latency up to 200 mSec.
The chart shown in Figure 12-11 shows that you very quickly exceeded the acceptable limits of latency
which is 10 mSec. In fact going back to the data you can see that latency was 6 mSec at just 8 outstanding
I/Os. Given this, the maximum acceptable throughput for this disk array for this I/O type is 1,169 IOPS
and 9MB/Sec which occurred at 8 outstanding I/Os.
You can use the same technique to test the Random Read and Sequential Read and Write for the storage
subsystem.


Search WWH ::

Custom Search