Databases Reference
In-Depth Information
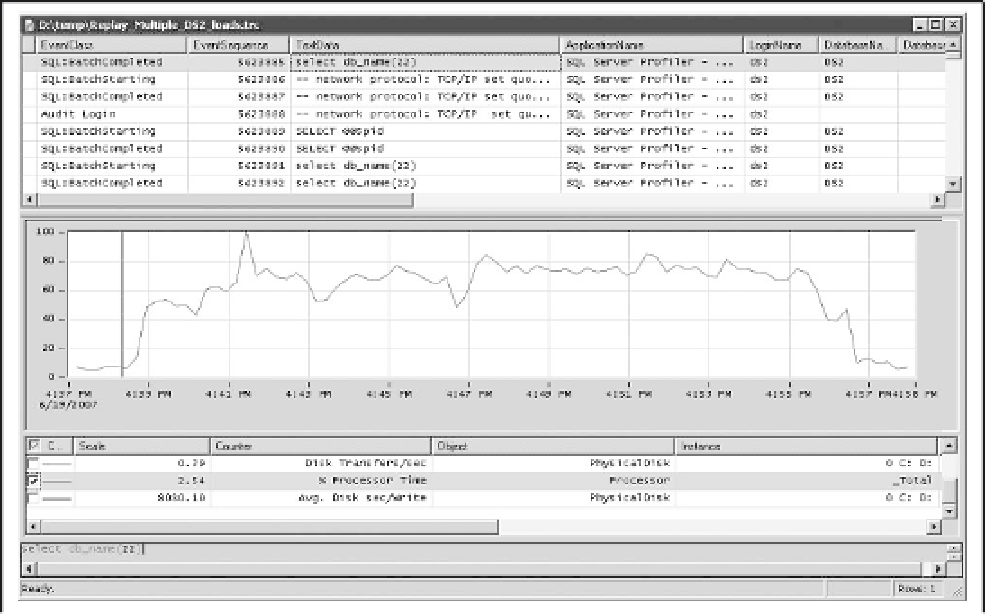
Figure 10-24
*Disk I/O:
We measured the disk throughput in terms of average disk seconds per read (write).
The Avg. Disk sec/Read (Write) is the average time, in seconds, it takes a computer to read
(write) from the disk. As shown in Figure 10-25, the average time for a read is about four mil-
liseconds (for a write, it is two milliseconds). The threshold for the disk on the server is 25
milliseconds.
❑
Database Batch Requests per Second:
Figure 10-26 shows the number of batch requests sent to
SQL Server, which averaged about 361 requests per second.
❑
SQL Server Memory:
The buffer cache hit ratio indicates the percentage of requested data found
in the memory buffer. Figure 10-27 indicates the average was 99.85 percent.
❑
The following figures show the SQL query performance point of view:
❑
*User-Transaction Response Time:
As shown in Figure 10-28, on average, all user transac-
tions responded in milliseconds. Source scripts can be downloaded from the publisher's web
site.
❑
Number of RPC and Batch Completed per Minute Distributions:
Figure 10-29 shows that
the first result column represents timestamps and the second column represents the number
of database events (RPC:Completed and SQL:BatchCompleted) completed by SQL Server per
minute.
Copy and paste the above results to Excel. Graphing the information provides a minute-by-minute view
of total RPC and SQL Batch Completed events, as shown in Figure 10-30.


Search WWH ::

Custom Search