Databases Reference
In-Depth Information
The replay time from a Profiler replay provides you with a new performance reference. In addition to
measuring the performance as listed in Table 10-1, you can compare different replay-times in different
server configurations.
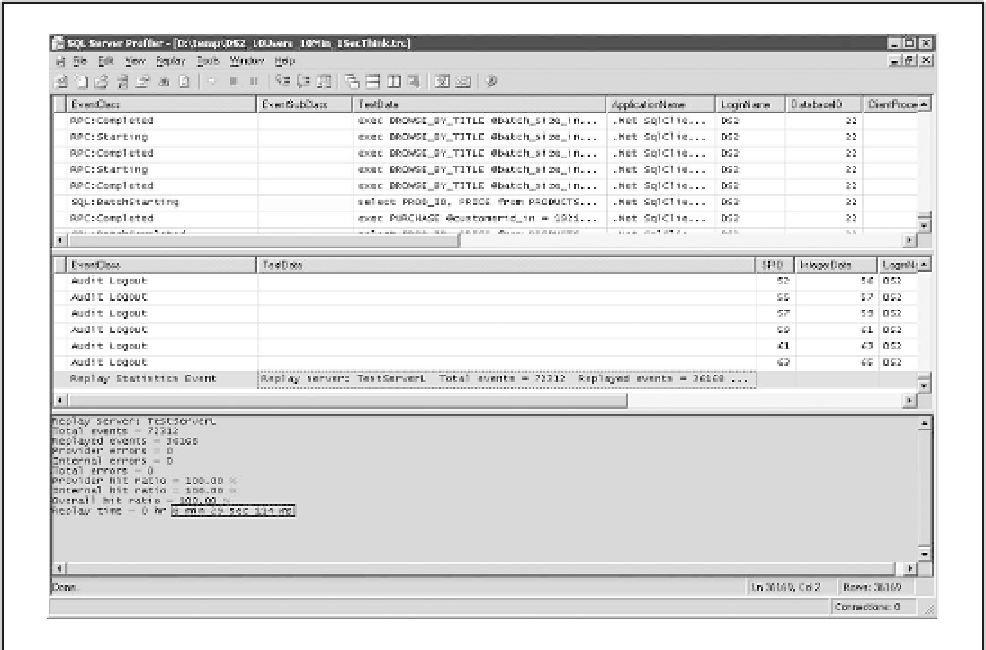
In the following example, the workload represents 10 minutes of evenly distributed trace events. As
Figure 10-12 indicates, the Profiler reported that it replayed the entire workload in 8 minutes, 29 seconds,
and 114 milliseconds.
Figure 10-12
Sometimes it is beneficial to capture both system performance metrics and SQL events during the work-
load replay. Note that the default Profiler setting excludes the events from SQL Profiler. When you trace a
workload during the workload replay, be sure to configure the ApplicationName column filter to include
the SQL Server Profiler application as shown in Figure 10-13.
Each time the workload is replayed on a stable target server with a constant load under the same
database conditions, the results should be consistent. If the results vary by a large percentage, check
to see if the replay has encountered any errors. You need to restore the database between
each run.
The total workload replay time provides an overall measurement for the total response time of the work-
load. For performance tuning, after making any improvement on the target server and replaying the
workload, simply compare the new replay time with the reference replay time established earlier. This
will provide evidence of any overall performance gain.


Search WWH ::

Custom Search