Databases Reference
In-Depth Information
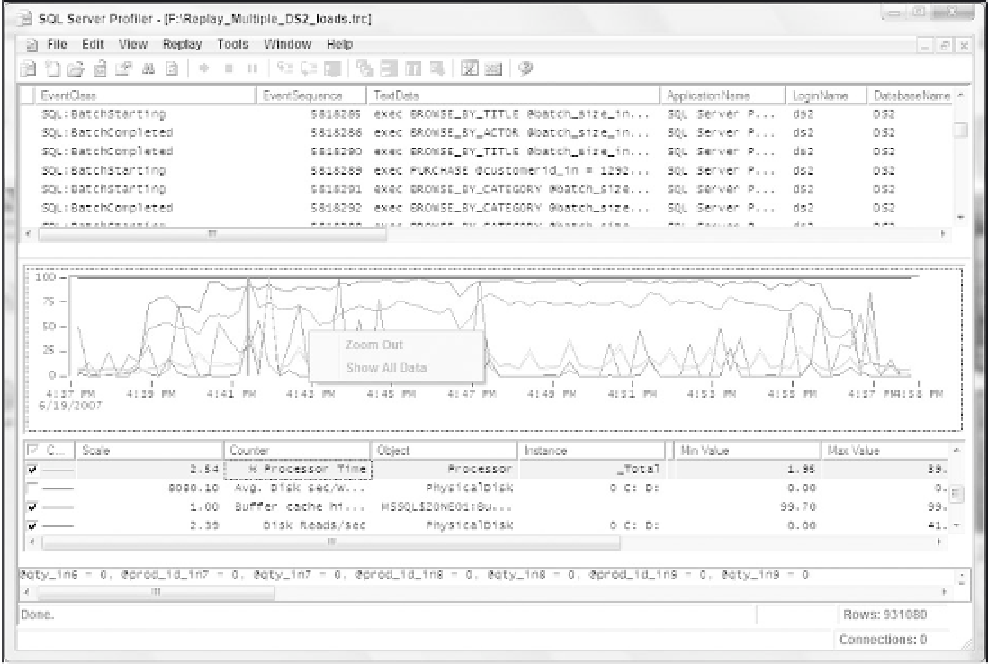
Figure 5-34
Summary
This chapter began with preparations for setting up a SQL trace. You learned what to look for in an
issue
statement, what trace options you have in SQL Server 2005, and important factors to consider
when minimizing the overhead associated with a trace. You reviewed Profiler usage scenarios for cap-
turing blocking events, Showplan XML data, deadlock graphs, and identifying long-running queries. You
examined the steps needed to generate a server-side trace code and examined the server-side trace code
in detail. Finally, you reviewed the new feature of correlating SQL trace data with Windows performance
counter data.
In Part 2 of this topic, you will be looking at resolving bottlenecks with tuning.


Search WWH ::

Custom Search