Databases Reference
In-Depth Information
As with any scripting code development, after you modify the original code, you should test and
validate it.
Open a query window, connect to a SQL Server instance, open the server-side script file, and execute it
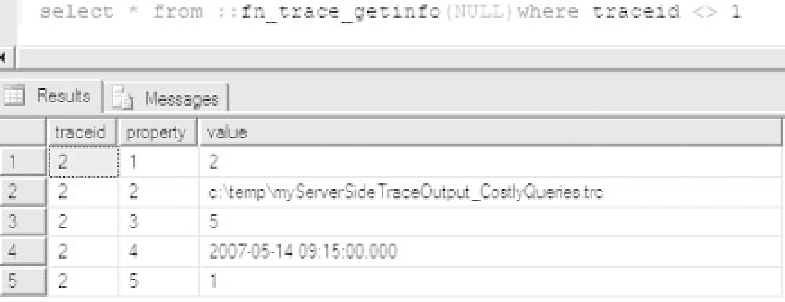
to start a server-side trace. If the code has no defect, a new trace ID will be created, as seen in Figure 5-28.
The output trace file in this example will be created on the server side, which resides on the monitored
SQL server. Use the following statement to query all traces on the server.
select * from ::fn_trace_getinfo(NULL)where traceid
<>
1
Figure 5-28
After the validation, stop and remove the trace that was just created and delete the trace output file.
Using the following command, replace
<
traceID
>
with the trace ID created from your testing:
EXEC sp_trace_setstatus
<
traceID
>
, 0 -- To stop a trace
EXEC sp_trace_setstatus
<
traceID
>
, 2 -- Closes and deletes the specified trace
Executing Server-Side Scripts
When it is time to start the trace, you can either schedule a SQL agent job to start the trace at
'2007-05-14
09:00:00.000'
or alternatively wait until the starting time to manually execute the trace script from a
SQL Query Window.
In this example, you use the same
populate.sql
script as before to generate database queries.
Handling Trace Files and Analyzing Trace Data
After the server-side trace stops, you can now analyze the resulting trace data.
OpeningTraceRolloverFilesintoSQLProfiler
Since your output trace data is a set of rollover files, you want to configure the SQL Profiler to load all
these files in sequence without prompting. To do this, select Tools
Options from the Profiler menu
to bring up the General Options screen and then select the option Load All Rollover Files In Sequence
Without Prompting, as shown in Figure 5-29.
➪


Search WWH ::

Custom Search