Databases Reference
In-Depth Information
In the following scenario, you want to capture costly queries in stored procedures or SQL statements. For
this, you need to have CPU, Reads, Writes, and Duration information in your trace file for analysis. You
will use SQL Profiler to generate a server-side trace code.
Using Profiler to Generate Server-Side Trace Script
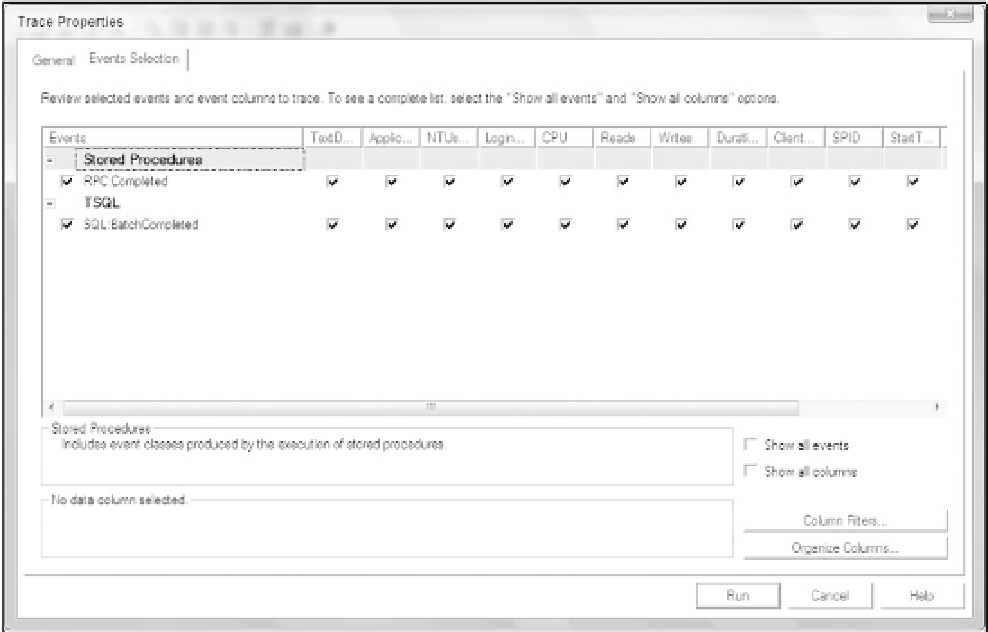
You can use SQL Profiler to define a trace to meet your requirements. Start Profiler, make a connection
to a SQL 2005 instance, select the Standard template, check the box for Enable trace stop time, and then
click the Event Select tab. Unselect all events but RPC:Completed and SQL:BatchCompleted, as shown
in Figure 5-25. Depending on who processes the trace data and what the purpose is of collecting the trace
data, it is also a common practice to include the SP:StmtCompleted event. If you include
the SP:StmtCompleted event, you can get to the individual statement in the stored procedure that is
causing the problem. The downside is that you will have more data to process and the size of the trace
output file will be larger.
Figure 5-25
Set the CPU filters to greater than 50 (ms). Set the Duration filter to greater than 2000 (ms), as shown in
Figure 5-26.
After defining the filters, click Run to start the trace, and then immediately stop the trace. Click File
➪
Export
For SQL Server 2005, as shown in Figure 5-27. Save the script to a file.
The server-side trace code is then generated.
➪
Script Trace Definition
➪


Search WWH ::

Custom Search