Databases Reference
In-Depth Information
10.
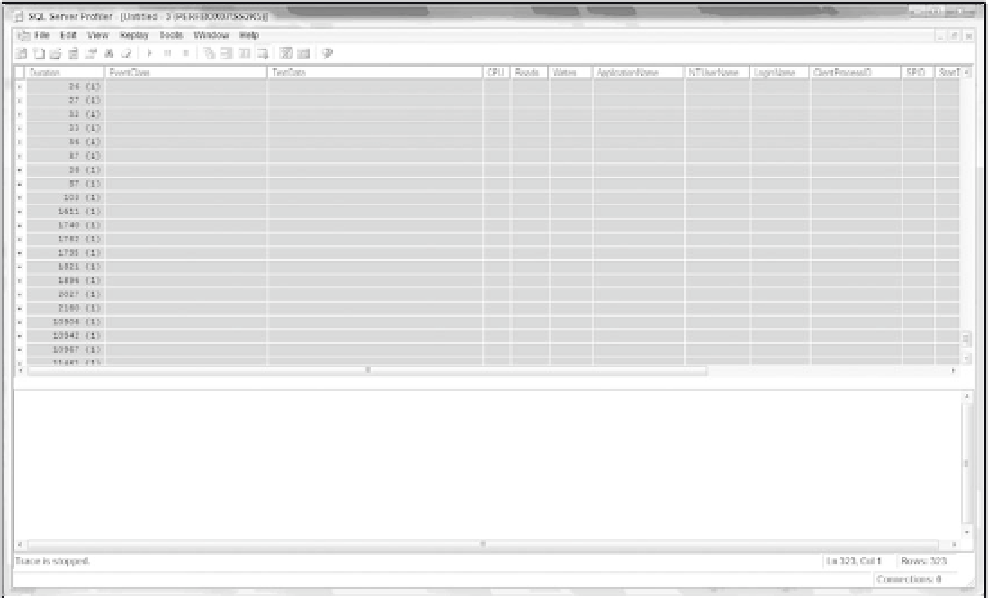
In about a minute, you should see the events that are captured. Once the events have been
captured, stop the trace (see Figure 5-18).
Figure 5-18
11.
The
populate.sql
script generated the workload sample. From Figure 5-18, under the
Duration column, the longest running queries are arranged from the bottom to the top of
the screen. You also see that most entries (starting from the bottom of the screen) in the
duration column are longer than 2000 milliseconds. From this information, you can re-adjust
the duration filter criteria accordingly. In this case, you update the Duration filter (defined in
the step 6) from the value 2 to 2000 (under the Greater Than Or Equal label).
12.
Save the Trace to a template.
Tracing
Your trace has been defined, validated, and saved into a template. You can now begin to trace for the
duration of your simulations.
1.
From SQL Profiler, open and run the trace template you saved from the previous step (Step
12 in the previous section). Re-start the event generation script
populate.sql
.
2.
After the script is completed, stop the trace.
3.
Click the View menu, click Grouped View, and you should see results similar to Figure 5-19.
Please note actual results depend on the speed of the system hardware.


Search WWH ::

Custom Search