Databases Reference
In-Depth Information
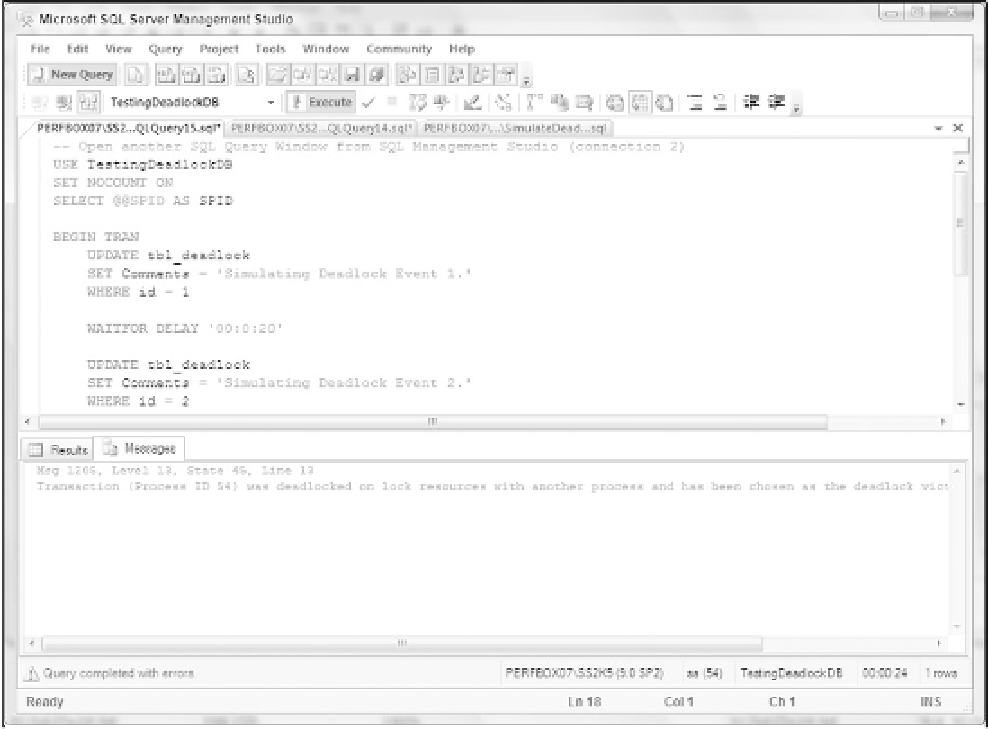
Figure 5-13
Profiler captures the deadlock event with the following information (see Figure 5-14). Let's go over events
captured in Profiler one by one:
❑
Line 1:
Trace Start.
❑
Lines 2 and 3:
The SQL Server lock manager thread (SPID 5) detected a circular blocking chain
with SPID numbers 53 and 54. The database name is TestingDeadLockDB.
❑
Line 4:
The transaction from SPID 54 was canceled and rolled back. A detailed execution query
statement was captured in the TextData column. The confirmation is indicated in the Deadlock
graph event.
❑
Line 5:
The transaction from SPID 53 was completed.
❑
Line 6:
A deadlock graph was produced. From the graph, it is clearly indicated that the SPID
54 was the victim (because it is crossed out). If you move a mouse over any symbol on the graph,
execution statements encountered are displayed.
Prior to SQL Server 2005, to get a deadlock graph, it was necessary to turn on deadlock trace flags and
collect deadlock data from the SQL Server error log. Now, Profiler provides a much easier way to capture
all deadlock events. For troubleshooting and deadlock scenarios, the deadlock graph provides not only a
visual presentation of a circular blocking scenario but also the execution statements involved.


Search WWH ::

Custom Search