Databases Reference
In-Depth Information
Capturing Deadlock Graphs
Because each process is preventing the other process from getting a required resource, a deadlock
occurs when two SQL Server system process IDs (SPIDs) are waiting for a resource and neither process
can proceed.
SQL Server has a lock manager thread that checks for deadlocks. When a deadlock is detected, in order
to break the deadlock, the lock manager will choose one of the SPIDs as a victim. The lock manager then
cancels the current batch for the victim, rolls back its transaction, and issues an error message as in the
following example:
Transaction (Process ID 53) was deadlocked on lock resources with another
process and has been chosen as the deadlock victim. Rerun the transaction.
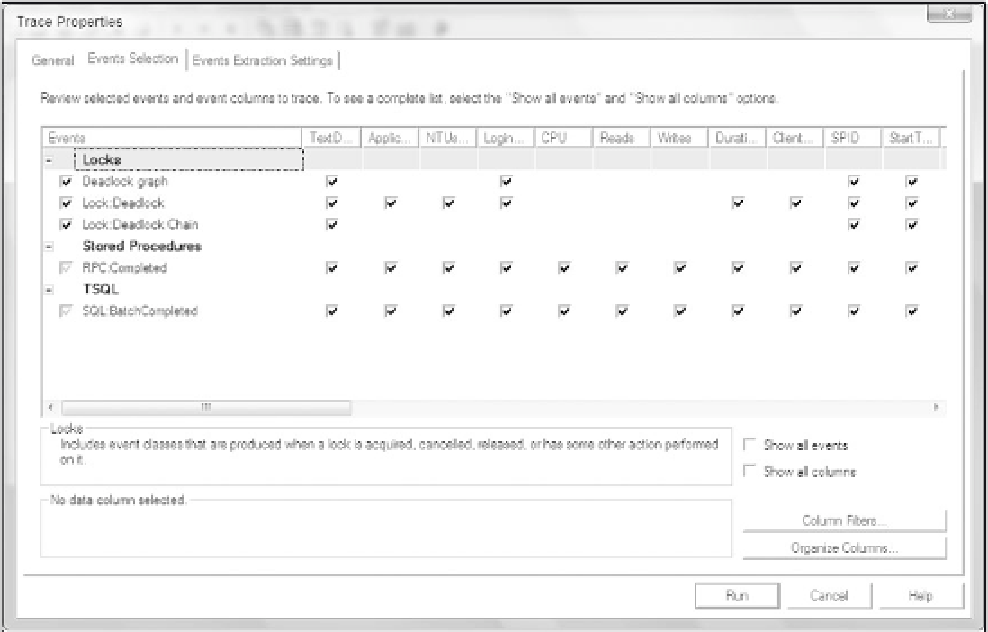
If deadlocks happen frequently, database applications suffer. SQL Server Profiler can create a trace to
capture deadlock events for analysis. Use the following event classes to configure a Profiler trace (also,
see Figure 5-11):
❑
Lock:Deadlock Chain:
Monitors when deadlock conditions occur.
❑
Lock:Deadlock:
Identifies which SPID was chosen as the deadlock victim.
❑
Deadlock Graph:
Provides an XML description of a deadlock. This class occurs simultaneously
with the Lock:Deadlock event class.
❑
RPC:Completed:
Indicates that a remote procedure call has been completed.
❑
SQL:BatchCompleted:
Indicates that the Transact-SQL batch has completed.
Figure 5-11


Search WWH ::

Custom Search