Databases Reference
In-Depth Information
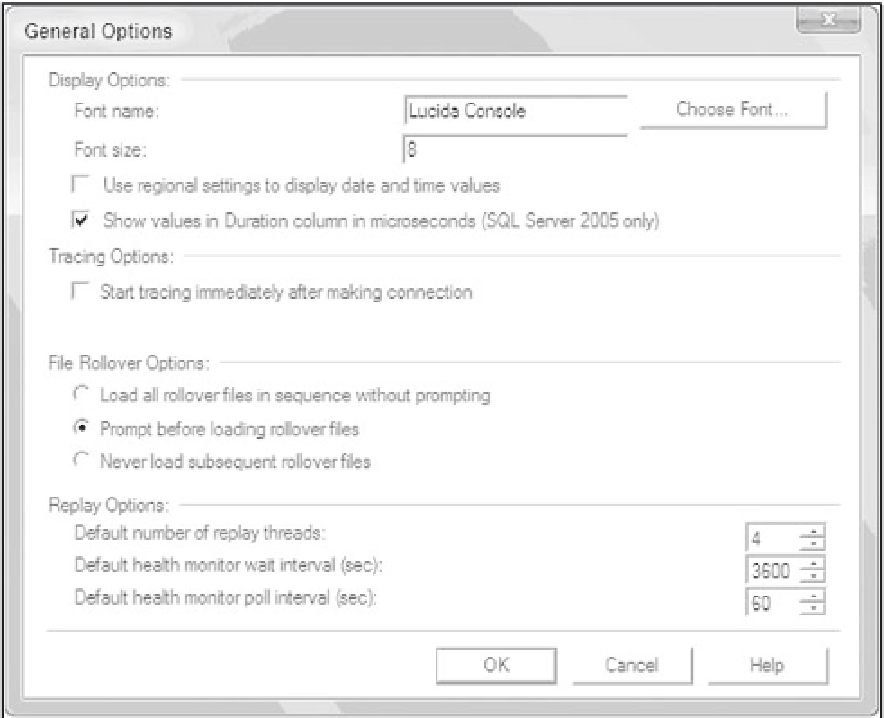
With SQL Server 2005 Profiler, you can optionally configure the Duration column to be set in
microseconds so that the Duration measurement will be consistent among the graphical user interface,
file, or database table. To do this, select Tools
Options from the Profiler menu, and then select the check
box Show values in Duration column in microseconds (SQL Server 2005 only), as shown in Figure 5-4.
➪
Figure 5-4
Capturing Blocking Events
Prior to SQL 2005, there were many scripts made available from various sources to capture
what processes are blocking and what processes are being blocked. However, these scripts require
manual execution. The sp_blocker (and its variation) is an example.
To configure Profiler, you only need the new SQL Trace event class listed below and must configure a
threshold value in SQL Server for detecting blocking events.
❑
Blocked Process Report:
This indicates that a task has been blocked for more than a specified
amount of time. This event class does not include system tasks or tasks that are waiting on
non-deadlock-detectable resources. Figure 5-5 is an example of this configuration.


Search WWH ::

Custom Search