Databases Reference
In-Depth Information
❑
Applications and user logins:
If a specific issue is involved in an application or user login, you
can use this information to filter trace events.
❑
SQL trace events:
Matching issue symptoms with SQL trace events accounts for a major
part of the trace setup. A trace event might represent various activities generated by
SQL Server: a stored procedure executed, a scheduled SQL agent job started, or a database lock
acquired. Matching issue symptoms with traceable events is a non-trivial task. This requires
knowledge of the system environment, including hardware, OS, and application software.
Actual working experience is essential to the success of a trace. Being familiar with common
scenarios and commonly used trace events are good starting points.
❑
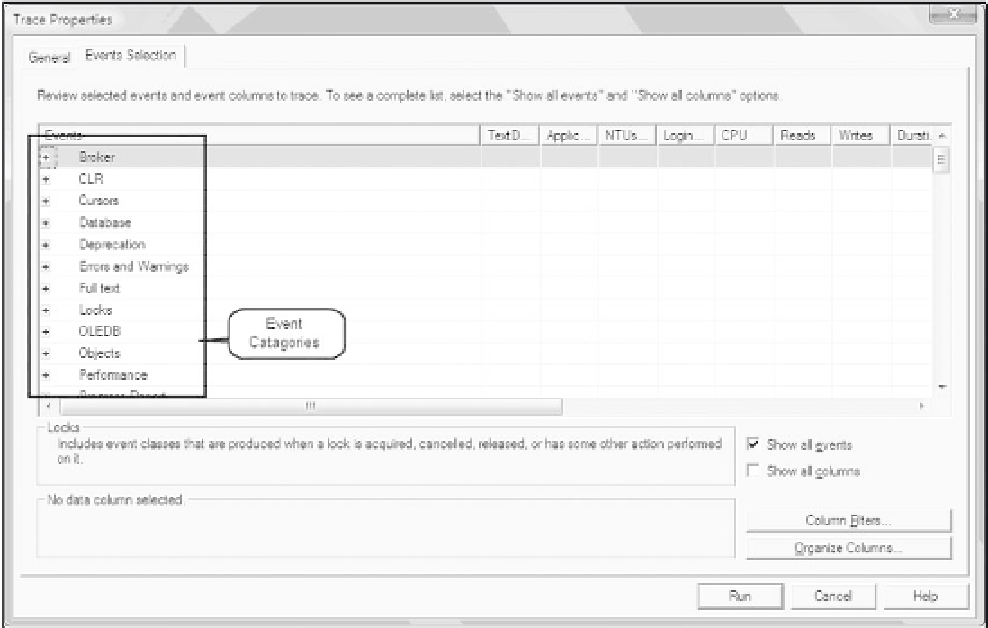
Event category:
Within SQL Profiler, an event category groups event classes. For example, all
lock event classes are logically grouped into the Locks event category (see Figure 5-1). The event
class corresponds to a predefined traceable event in SQL server.
Figure 5-1
❑
Event class:
An event class is a specific type of event that can be traced by a SQL Server
instance. The event class contains all of the data that describes an event. There are
approximately 200 event classes in SQL Server 2005. In SQL Profiler, event classes are organized
under event categories. Each event class is associated with its own set of data columns (TextData,
ApplicationName, LoginName, CPU, and so on), as shown in Figure 5-2.


Search WWH ::

Custom Search