Biology Reference
In-Depth Information
(A)
X
gene A
Node
Edge
TF-X
A
(B)
(C)
(D)
[
A
]
K
1
[
A
]
K
2
[
A
][
A
]
K
1
K
2
K
AA
1
+
+
+
F
=
P
A
A
[
A
]
K
1
K
AP
[
A
]
K
2
K
AP
[
A
][
A
]
K
1
K
2
K
AP
[
P
]
K
P
1
+
+
+
1
2
1
2
K
AP
K
AA
L1
L2
K
1
K
2
K
P
20
L1*
L2 vs. L1
L2
Δ
Δ
1
18
L1L2 vs L1*
L2
L1*L2* vs L1L2
Δ
16
0.8
L1
Δ
L2 or
Δ
L1L2
L1*
L1L2*
L1L2 − no synergy
L1L2 − synergy
L1*L2* − synergy
Δ
L2 or
Δ
14
12
0.6
10
8
0.4
6
4
0.2
2
0
0
0.25
1
4
16
64
256
1024
4096
0.25
1
4
16
64
256
1024
4096
[Prep1] (nM)
[Prep1] (nM)
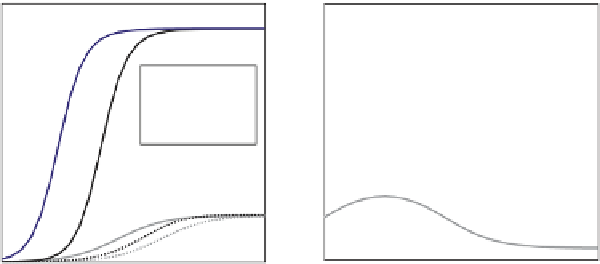
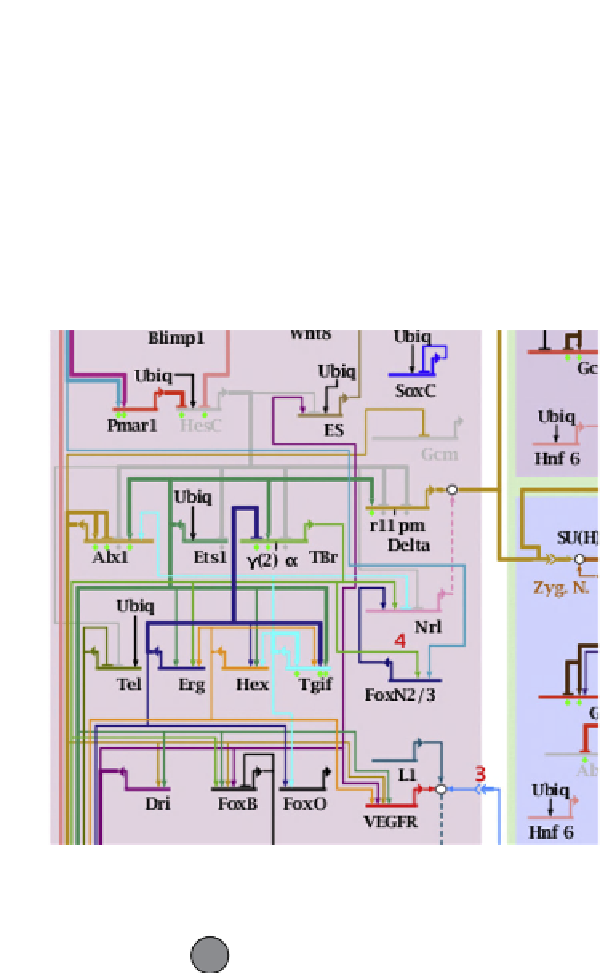
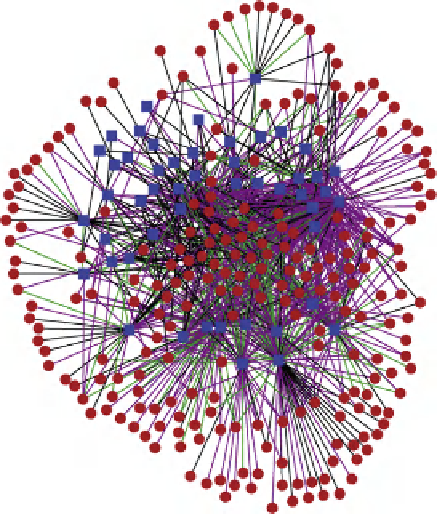
FIGURE 4.2
Gene regulatory network visualization. (A) Regulatory and/or physical interactions between a TF and a target gene can be visualized in
GRN diagrams that contain nodes (the TFs and their target genes) and edges (physical and/or regulatory relationships between TFs and their target genes).
(B) Section of a high-resolution wiring diagram of endomesoderm development in sea urchin (see Chapter 11). (C) Cytoscape-generated GRN of physical
interactions between C. elegans TFs and metabolic gene promoters
[28]
. (D) Prep1 binding to two lower-affinity binding sites (L1 and L2) in the Pax6
ectodermal enhancer (EE) drives expression of Pax6 in the developing mouse lens. The Prep1 dependence of the EE was described using a biophysical
model of Prep1 molecules (A in schematic) binding to sites L1 and L2 and synergistically recruiting a required co-factor (P in schematic). The model was