Biology Reference
In-Depth Information
pattern that can be adequately described mathematically
within the framework of continuous differential equations
using terms that describe diffusion. As anticipated in
1933
[27]
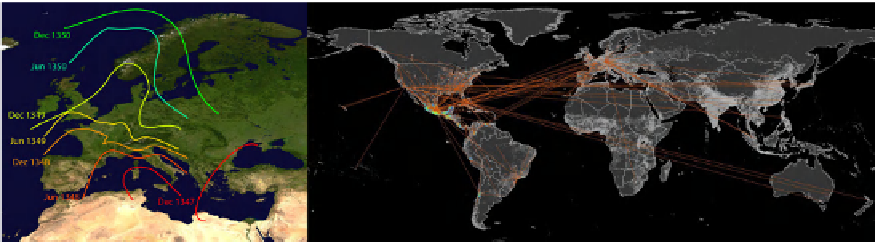
, the large scale and geographical impact of
infectious diseases (such as the SARS epidemic
[29]
or the
recent swine flu epidemic) on populations in the modern
world is mainly due to commercial air travel. An epidemic
starting in Mexico rapidly reaches Europe and Asia
(
Figure 27.5
). This picture cannot be simply described in
terms of diffusive phenomena, but must incorporate the
spatial structure of modern transportation networks.
The conceptual framework to approach spatially struc-
tured population is the patch or meta-population modeling
framework that considers multiple subpopulations coupled
by movements of individuals. These models are defined by
the network describing the coupling among the populations
along with the intensity of the coupling, which in general
represents the rate of exchange of individuals between two
populations. Networks are also, in this case, the underlying
substrate for the diffusion process. Meta-population models
can be devised at various granularity levels (country, inter-
city, intra-city) and the corresponding networks therefore
include very different systems and infrastructures. This
implies scales ranging from the movement of people within
locations of a city to the large flows of travelers among
urban areas.
At the formal level meta-population models fall into the
category of reaction
variable degree block variable N
k
represents the average
number of particles in nodes with the degree k. The use
of the HMF approach amounts to the assumption that
nodes with degree k, and hence the particles in those
nodes, are statistically equivalent. In this approximation
the dynamics of particles randomly diffusing on the
network is given by a mean-field dynamical equation
expressing the variation in time of the particle subpopu-
lations N
k
(t) in each degree block k. This can easily be
written as:
k
X
k
dN
k
ð
Þ
dt
¼
t
k
0
j
d
k
N
k
ð
t
Þþ
P
ð
k
Þ
d
k
0
k
N
k
0
ð
t
Þ
The first rhs term of the equation just considers that only
a fraction of particles d
k
moves out of the node per unit
time. The second term instead accounts for the particles
diffusing from the neighbors into the node of degree k. This
term is proportional to the number of links k times the
average number of particles coming from each neighbors.
This is equal to average over all possible degrees k
0
the
fraction of particles moving on that edge d
k
0
k
N
k
0
(t)
according to the conditional probability P(k
0
j
k) that an edge
belonging to a node of degree k is pointing to a node of
degree k
0
. Here the term d
k
0
k
is the diffusion rate along the
edges connecting nodes of degree k and k
0
. The rate at
which individuals leave a subpopulation with degree k is
then given by d
k
¼
k
P
k
0
P
k
0
j
d
kk
0
. The function P(k
0
j
k)
encodes the topological connectivity properties of the
network and allows study of the different topologies and
mixing patterns. The above equation explicitly brings the
diffusion of particles into the description of the system. The
equation can be simply generalized to particles with
different states and reacting among them by adding
a reaction term to the above equations. For instance the
generalization of the SIR model described in the text would
consider three types of particles denoting infected,
susceptible and recovered individuals. The reaction term
that would take place among individuals in the same node
would be the usual contagion process among susceptible
and infected individuals and the spontaneous recovery of
infected individuals.
ð
k
Þ
diffusion processes, where each node
i is allowed to have any non-negative integer number of
particles N
i
so that the total particle population of the
system is N
e
¼
P
i
N
i
. In this case particle network
frameworks extend the HMF approach to the case of
reaction
diffusion systems in which particles (individuals)
diffuse on a network with arbitrary topology. A convenient
representation of the system is therefore provided by the
quantities defined in terms of the degree k
e
X
1
V
k
N
k
¼
N
i
i
j
k
i
¼
k
where V
k
is the number of nodes with degree k and the
sums run over all nodes i having degree k
i
equal to k.The
FIGURE 27.5
Historical and modern epidemics. (Left) Map of the propagation of the Black Death in the 14th century. The epidemic front spread in
Europe with a velocity of 200
e
400 miles per year. (Right) Epidemic tree of the first 120 days of the 2009 H1N1 pandemic.