Biology Reference
In-Depth Information
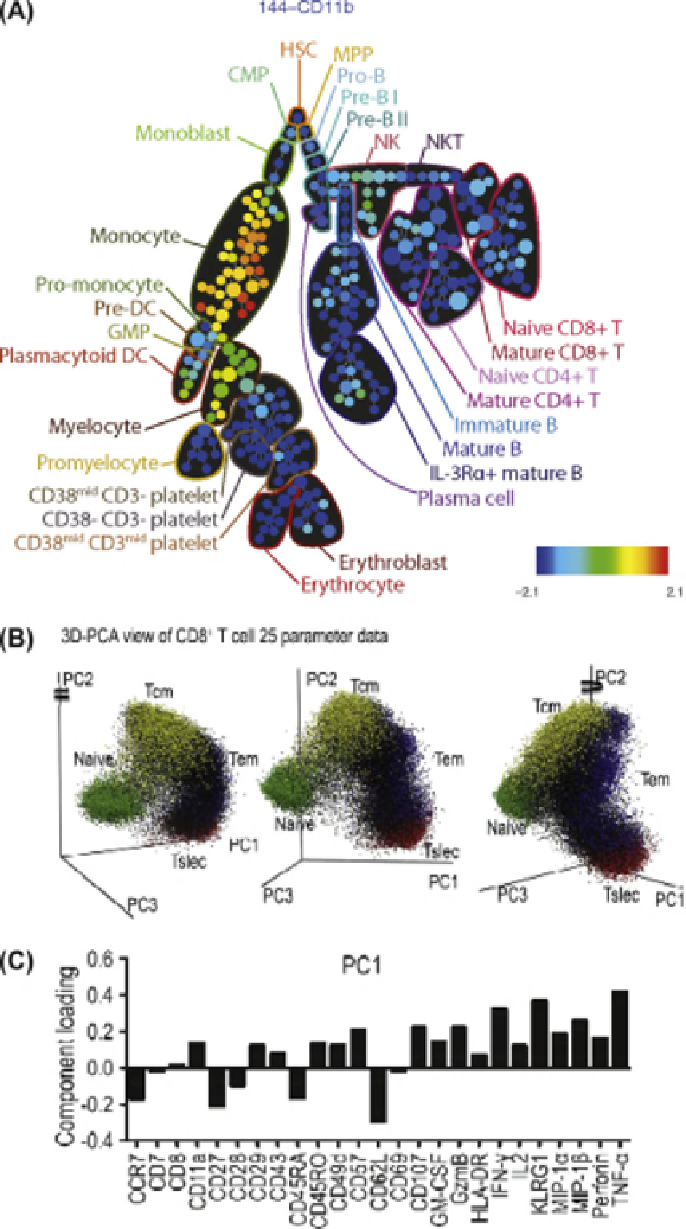
FIGURE 25.2
Mass cytometry enables single-cell highly dimensional analysis of immunity and demands new algorithmic and visualization
techniques. (A) Immunophenotypic progression in healthy human bone marrow measured using mass cytometry profiling and visualized by SPADE in
a tree plot. Tree was constructed by using 13 cell-surface antigens. The size of each circle in the tree indicates the relative frequency of cells that fall within
the 13-dimensional confines of the node boundaries. Node color is scaled to the median intensity of marker expression of the cells within each node,
expressed as a percentage of the maximum value in the data set (CD11b is shown). Putative cell populations were annotated manually and are represented
by colored lines encircling sets of nodes that have CD marker expression emblematic of the indicated subset designations. (Taken from
[2]
.) (B) One mass
cytometry data set is plotted on the first three principal component axes (a representative PMA
þ
ionomycin-stimulated CD8
þ
T cell sample) and shown
from three different perspectives (rotated around the PC2 axis). After gating by surface marker phenotype, naive (green), central memory (Tcm, yellow),
effector memory (Tem, blue), and short-lived effector (Tslec, red) cell populations are overlaid to identify the main phenotypic clusters. (C) The principal