Biology Reference
In-Depth Information
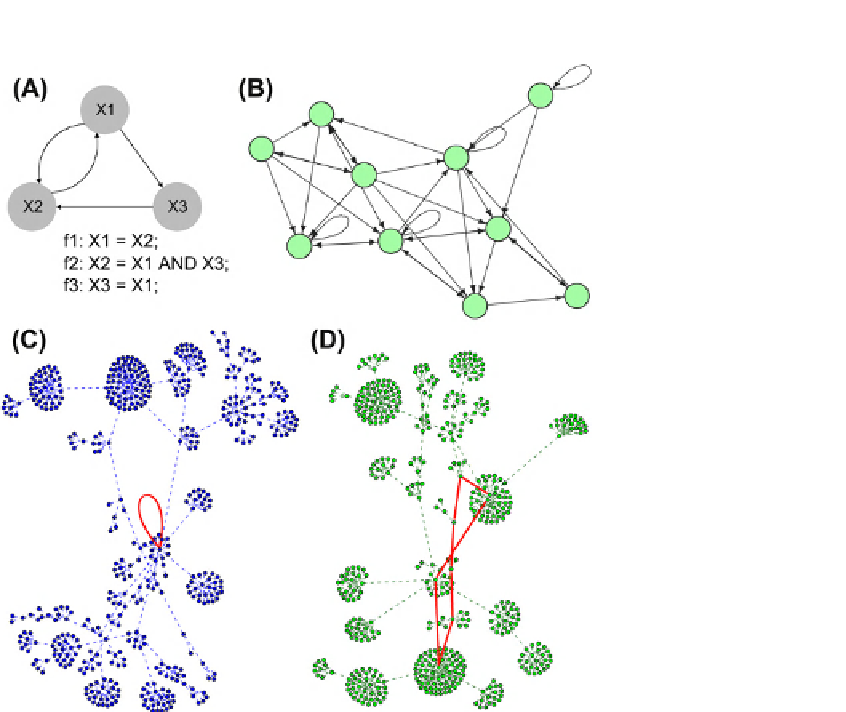
FIGURE 22.5
Boolean networks and basins of attraction. (A) A formal description of a directed Boolean network; three Boolean functions (f1-f3)
link the network nodes. (B
e
D) Examples of Boolean networks and their dynamical solutions. (C) A basin for a single point attractor. The network nodes
correspond to vectors of on/off node states. Red edge (loop) corresponds to a transition between the attractor states (the same state). (D) A basin for a cycle
attractor. The red edges show transition between the consecutive attractor states. These cyclic attractors were observed in networks describing periodic
biological processes, such as the cell cycle.
dependency and regulation among nodes based on state
transition tables corresponding to time series of gene
expression patterns. As a result, a minimal set of inputs is
identified that can uniquely determine the output at the next
time point for each variable in the network. In practice,
a semi-quantitative approach has been developed to infer the
regulatory interactions in differentiating embryonic stem
cells from gene expression data. The method combines the
Boolean updating framework with internal continuous
expression levels
[93]
. The resulting optimized network
revealed a hierarchical structure with Oct4, Nodal and E-
cadherin on top and regulatory flow to Foxa2 through Oct4.
To facilitate the construction of BNs, there are several
software packages available for (re)constructing, simu-
lating and visualizing Boolean networks (
Table 22.1
). For
example, general toolboxes such as the RBN toolbox, the
PBN toolbox
[30]
and the CellNetOptimizer
[94]
are
publicly available and can be used in programming under
the Matlab environment. Additionally, CellNetOptimizer
can be downloaded as a Bioconductor package in R. Other
interactive graphics tools such as NetBuilder
[95]
and
DDlab
[96]
allow users to create, visualize and simulate
genetic regulatory networks, including discrete Boolean
networks. Additionally, BooleanNet
[97]
is a tool used to
simulate gene regulatory networks in a Boolean formalism;
similarly, the R package BoolNet
[98]
can generate,
simulate and reconstruct Boolean networks with support
for three types of BN: synchronous, asynchronous and
probabilistic. It also integrates with existing visualization
tools such as Pajek
[99]
and BioTapestry
[100]
.
Modular Network Design: from Kernels
to Integrated Models
Self-renewal or differentiating cell states are characterized
by specific molecular signatures involving protein, mRNA
and miRNA concentrations as well as numerous specific
genetic and epigenetic interactions
[15,59,101,102]
.In
turn, these genome-wide changes are believed to be under
the control of small genetic networks (kernels) at the top of
a gene regulatory hierarchy. Known or suggested kernels
are shown in
Figure 22.1
for ESC and HSC. In the case of
pluripotent stem cells, the emerging core circuit (kernel)
may include three to six transcription factors (Nanog, Oct4,
Sox2, Klf4, Myc, Tcf3)
[20,34,35,103,104]
. This particular


