Biology Reference
In-Depth Information
Interactome Networks and
Genotype
Phenotype Relationships
Since drafts of a composite reference human genome
sequence were released 10 years ago, powerful techno-
logical developments, such as next-generation sequencing,
have started a true revolution in genomics
[11
e
14]
.
With time, most human genotypic variations will be
described, together with large numbers of phenotypic
associations. Unfortunately, such knowledge cannot trans-
late directly into new mechanistic understanding or thera-
peutic strategies, in part because the 'one-gene/one-
enzyme/one-function' concept developed by Beadle and
Tatum oversimplifies genotype
e
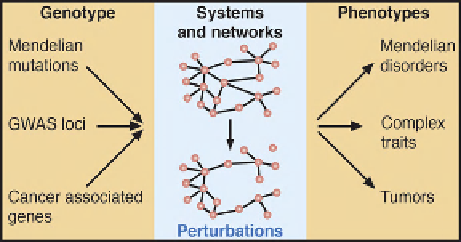
FIGURE 3.2
Interactome networks
and genotype
e
phenotype
relationships.
phenotype relationships
[15]
. In fact, Beadle and Tatum themselves state so in the
introduction of their groundbreaking paper that initiated
reductionism in molecular biology: 'An organism consists
essentially of an integrated system of chemical reactions
controlled in some manner by genes. Since the components
of such systems are likely to be interrelated in complex
ways, it would appear that there must exist orders of
directedness of gene control ranging from simple one-to-
one relations to relations of great complexity.'
So-called complex traits provide the most compelling
evidence of complexity between genotypes and pheno-
types in human disease. Genome-wide association studies
have revealed many more contributing loci than originally
anticipated, with some loci contributing as little as a few
percent to the heritability of the phenotype(s) of interest.
Simple Mendelian traits are not
e
the complexity of genotype
phenotype relationships,
including susceptibility to human disease (
Figure 3.2
).
e
Mapping and Modeling Interactome
Networks
In the path towards deciphering the mechanisms underlying
genotype
phenotype relationships, it helps to abstractly
simplify the complexity of interactomes by modeling.
Interactomes can be effectively modeled as network
representations of biological relationships among biomol-
ecules. This abstraction converts a complex web of bio-
logical relationships into a graph, allowing the application
of intuition and mathematical concepts of graph theory.
The power of graph theory in revealing emergent
properties of complex systems is exemplified by a social
science experiment of the 1960s. Stanley Milgram
attempted to follow the path of letters sent through the mail
in order to measure the average number of 'degrees of
separation' between people, thereby providing a network
representation of human society. He famously found that
humans are connected on average at a distance of six
degrees from each other, and our vision of the human
population on earth immediately became that of a 'small-
world'
[23]
. From politics to social media to modern
journalism, Milgram's discovery still resonates today, and
probably will for years to come.
In a network representation of interactomes, nodes
represent biomolecules and an edge between two nodes
indicates a biological relationship between the corre-
sponding biomolecules. In the cell, multiple types of
biomolecule, e.g., genes, proteins, RNAs, regulatory
elements, or small-molecule metabolites, can be connected
by multiple types of physical or functional biological
relationship. These can be combined into 'multicolor'
interactome network representations, where node colors
represent biomolecule types and edge colors represent
biological relationship types, refining complex biological
processes
[24]
. Binding of transcription factors to DNA
regulatory elements (physical relationship), regulation of
e
immune to complex
genotype
phenotype relationships either. Incomplete
penetrance, variable expressivity, differences in age of
onset, and modifier mutations are more frequent than
generally appreciated. These discrepancies in the one-
gene/one-function model appear across all phyla. In
worms, for example, where self-fertilization is possible
and growth conditions are easily controllable, it is not
uncommon to observe that a significant proportion of
mutant animals exhibit a near wild-type phenotype
[16,17]
(see Chapter 19).
Genome-wide functional genomic and proteomic
experiments also point to greater complexity than antici-
pated, leading one to ask fundamental questions about gene
function and evolution. How could a linear view of gene
function account for the seemingly small proportions of
essential genes
[18]
? How do genes become essential
during evolution in the first place? How to explain that
genes that are genetically required for particular biologic
processes are not necessarily transcriptionally regulated
during those same processes
[19]
? How to account for
increasing reports of 'protein moonlighting', where specific
gene products appear to be necessary for multiple biolog-
ical processes
[20
e
22]
? We argue that viewing and
modeling cells as interactome networks will help unravel
e