Biology Reference
In-Depth Information
FIGURE 17.3
Modeling the MinD/MinE system. Experiments and trial-and-error by simulation refine a four-node network of unknown causality to a putative network that reproduces key features of
the experiments. Main feature of the causality network are the red arrows: a positive feedback of MinD-dependent MinD recruitment to the PM and a more than linear increase of MinD
e
PM release
dependent on MinE
e
MinD binding. Gray arrows depict the coupling of MinE activity to MinD
e
PM binding (mainly PM-bound MinD is activated by MinE, and MinE is released fromMinD when not at
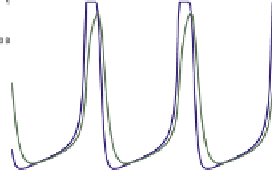
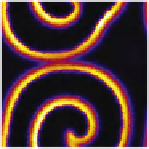
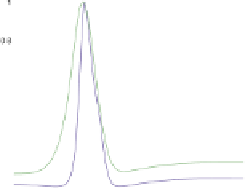
PM). The network exhibits oscillations in '0D' of well-mixed reaction vessels, and wave progression in 1D that does not quite match the experimentally measured profiles. However, in 2D spiral waves
and Turing patterns can be observed, and in a restricted 1D simulation the size of the cell sharply influences the time-average of MinDE peak concentration. Only in the case of medium size does the
maximum of MinE coincide with a minimum of MinD. This can result in downstream activation of cell division localization in space and time.