Biology Reference
In-Depth Information
(A)
(B)
Prolonged
Transient
MAPK
activity
c-Fos
levels
Positive
Feedback
Loop
Negative
Feedback
Loop
MAPK*
MAPK*
Rsk
Rsk
c-Fos
c-Fos
c-Fos-P
c-Fos-Ub
c-Fos-P
c-Fos-Ub
Incoherent
Feedback
Motif
Coherent
Feedback
Motif
Fos-dependent
gene expression
Proteasomal
degradation
Fos-dependent
gene expression
Proteasomal
degradation
(C)
(D)
Extracelluar
ligands (33)
Extracellular Ligands
Membrane Proteins and receptors
Central Signalling Network
Receptors
and other
membrane
proteins (63)
Central
signalling
network (311)
Transcription
machinery (37)
Ion channels
(16)
Electrical
Response
(Ion Channels)
Translation
machinery (33)
Secretory
apparatus (27)
Motility
machinery (25)
Transcription
Machinery
Translation
Machinery
Secretion
Apparatus
Motility
Machinery
FIGURE 16.4
Topology of cell signaling networks. (A) The structure of regulatory motifs: positive and negative feedback loops (upper panel) and
coherent and incoherent feedforward motifs (lower panel). Individual components are depicted as circles. Diagonal arrows depict signal flow into and out
of the motif. Arrows indicate activation and plungers indicate inhibition. (B) A coherent feedforward motif can help filter short from long duration signals.
The response of MAPK-1,2 activation involves the induction of immediate-early genes (IEGs), e.g., c-Fos. The presence of a feedforward motif within the
network allows MAPK signals with longer duration to phosphorylate c-FOS and protect it against ubiquitin-mediated degradation, enabling bridging
across timescales of minutes for MAPK activation and hours for c-Fos-regulated gene expression (reprinted with permission from
[59]
, based on
experiments from
[55]
). (C) The organization of a functional cell is shown as an interconnected network of a central signaling network and cellular
machines. The block diagram shows how information generated from extracellular ligands is transmitted to different cellular machines and functional
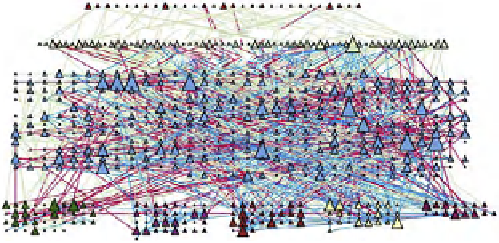
compartments. Numbers in parentheses represent the number of nodes. (D) Directed sign-specified network representation of signal flow: triangles
represent nodes and their size is proportional to their level of connectivity (i.e., number of edges). Interactions that lead to activation are visualized as
green arrows, while inhibitory ones are visualized as red ones and blue arrows represent neutral interactions (figures (C) and (D) reprinted with permission
from
[60]
).
difference in the timescale activation for MAPK (minutes)
and c-Fos-stimulated gene expression (hours).
signal processing may help control cellular decisions. The
CA1 neuron was represented as a set of interacting
components that make up a network of signaling pathways
that connects to various cellular machines (
Figure 16.4
C).
The fully connected network was built from known direct
interactions, with functional effects documented in the
experimental literature (
Figure 16.4
D).
To understand how signaling in the hippocampal neuron
may lead to synaptic plasticity, the authors analyzed signal
PROPERTIES OF A CELLULAR SIGNALING
NETWORK
A study of the minimal signaling network of a mammalian
hippocampal CA1 neuron
[60]
provides an example of how