Biology Reference
In-Depth Information
phenotypic variation in the population, as is commonly
seen among individual cells in culture.
break down with pathological consequences beyond this
neighborhood. At the level of specific phenotypic function,
the concept of robustness deals with the relationship
between the physiological behavior and the underlying
parameters of mechanistic models identified or hypothe-
sized. Most approaches at this level have dealt with the
local behavior as characterized by small (infinitesimal)
changes. Robustness according to these approaches corre-
sponds to parameter insensitivity
Enumeration of Qualitatively Distinct
Phenotypes
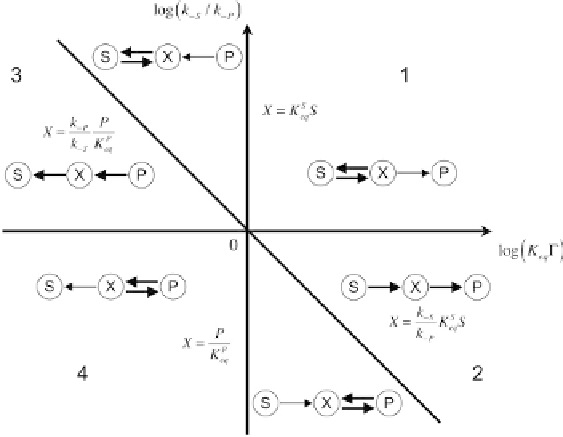
There are seven qualitatively distinct phenotypes for this
simple system, in agreement with our intuition (see also
Figure 15.5
). (a) The overall pathway operates with the first
reaction in quasi-equilibrium and the net flux in the forward
direction to the right (Case 1: upper right-hand quadrant). (b)
The overall pathway operates with the first reaction in quasi-
equilibrium and the net flux in the reverse direction to the
left (Case 1: upper half of the upper left-hand quadrant). (c)
The pathway operates quasi-irreversibly in the forward
direction (Case 2: upper half of the lower right-hand quad-
rant). (d) It operates quasi-irreversibly in the reverse direc-
tion (Case 3: lower half of the upper left-hand quadrant). (e)
The overall pathway operates with the second reaction in
quasi-equilibrium and the net flux in the reverse direction to
the left (Case 4: lower left-hand quadrant). (f) The overall
pathway operates with the second reaction in quasi-equi-
librium and the net flux in the forward direction to the right
(Case 4: lower half of the lower right-hand quadrant). (g)
Finally, the overall pathway is at thermodynamic equilib-
rium with zero net flux (vertical axis). In the case of more
complex systems, the phenotypes typically will not be
intuitively obvious, and not every assumption of dominance
will yield a valid phenotype, as will be shown below.
logarithmic sensitiv-
ities
[43,44]
, linear sensitivities
[45]
, or second-order
sensitivities
[46
e
48]
. All of these approaches have shown
what has been long known from experimental studies, that
there is a spectrum of sensitivities with many parameters
having very little influence and a smaller number having
the major impact.
Although local approaches are useful for addressing
the consequence of small changes, we need a global
equivalent of local robustness (defined as insensitivity to
small changes) in order to characterize the response to
large changes. We call this concept global tolerance,
and the boundaries between phenotypes in system
design space provide a natural way of quantifying this
concept
[49].
e
Characterizing Performance
The system representation within each phenotypic region is
always a simple S-system for which determination of local
non-linear behavior reduces to conventional linear analysis
[2,12]
. Thus, the phenotypes involving local (small) vari-
ations are completely determined, and their relative fitness
can be compared on the basis of relevant performance
criteria. These criteria can be quantified using logarithmic
gain, parameter sensitivity (local robustness), and response
time. The boundaries that delineate a given phenotype can
Robustness
Robustness of organisms is widely observed although
difficult to precisely characterize. Performance can remain
nearly constant within some neighborhood of the normal
operating regime, leading to homeostasis, but then abruptly
FIGURE 15.5
Phenotypes in the system design space for the
model in
Figure 15.3.
In each phenotypic region the pools
associated with the intermediate concentration X, and the envi-
ronmental concentrations S and P are represented graphically. The
relative thickness of the arrows suggests the dominant fluxes. See
legend for
Figure 15.4
and text for discussion.