Biology Reference
In-Depth Information
BOX 14.3 G2/M Checkpoint
The dynamic properties of the molecular regulatory system in
Figure B3A can be described by three differential equations for
B
d
B
d
t
¼ð
B
k
ab
þ
k
abd
D
T
B
Þ$ð
B
T
B
Þ
H
þ
¼
[MPF]
¼
[CycB:Cdk1], W
¼
[Wee1] and D
P
¼
[Cdc25-P]:
ε
H
(B3.2)
ð
k
ib
þ
k
ibw
W
T
B
Þ$
B
H
þ
ε
¼
V
activation
V
inactivation
d
B
dt
¼ð
k
ab
þ
k
abd
D
P
Þ$ð
B
T
B
Þð
k
ib
þ
k
ib
W
Þ$
B
;
(B3.1A)
are plotted in
Figure B3
C. The points of intersection of these
two curves are steady state solutions of Eq.
(B3.2)
. Clearly, the
dynamical system may exhibit bistability, and in
Figure B3
D
we indicate how the steady state values of B depend on B
T
,
with all other parameters fixed at their values in
Tabl e B3
.
d
D
P
d
t
¼
k
adb
B
$ð
D
T
D
P
Þ
k
idh
H
$
D
P
;
(B3.1B)
d
W
d
t
¼
k
awh
H
$ð
W
T
W
Þ
k
iwb
B
$
W
;
(B3.1C)
TABLE B3
Parameter values for the Wee1-MPF-
Cdc25 model
where k
a
.
and k
i
.
are rate constants for activation and
inactivation of the corresponding proteins, and the param-
eter H is the activity of the MPF-counteracting phosphatase.
Without loss of generality, we can choose the units of H so
that k
idh
Parameter
Value
Parameter
Value
k
ab
0
H
1
k
abd
1
B
T
0.3
k
adb
.
The steady state solutions of Eqs.
(B3.1B,C)
are D
P
¼
k
ib
0
D
T
1
¼
D
T
B/
(H
B), where D
T
and W
T
are the total
concentrations of Cdc25 and Wee1, as usual, and
þ
B) and W
¼
W
T
H/(
H
þ
ε
ε
k
ibw
1
W
T
1
k
awh
/k
iwb
.
D
P
and W as functions of B are plotted in
Figure B3
B, for the
representative parameter values in
Tab l e B3
. The rate curves,
ε
¼
k
awh
0.02
k
iwb
1
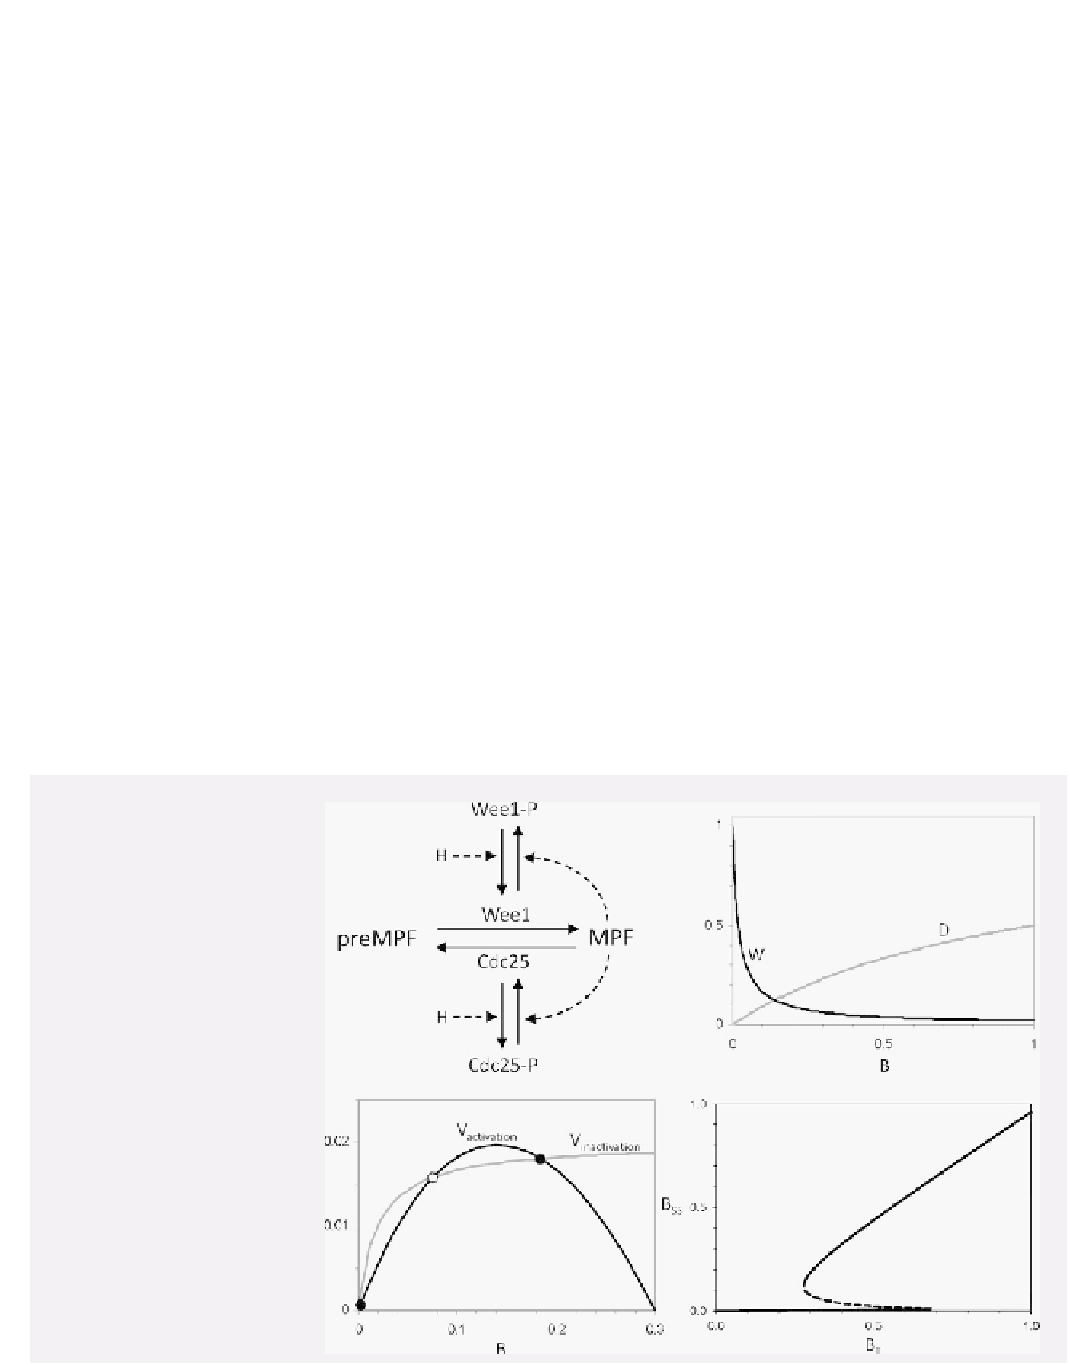
FIGURE B3
Bistability in a
model of the G2/M transition.
(A) Molecular regulatory network.
'MPF'
¼
active CycB:Cdk1 kinase,
'preMPF'
¼
inactive CycB:Cdk1-P
dimer, 'Wee1'
¼
tyrosine kinase
(less active in the phosphorylated
form), 'Cdc25'
¼
tyrosine phospha-
tase (more active in the phosphory-
lated form). H
¼
(A)
(B)
Clb2-counteracting
phosphatase. (B) Active forms of
Wee1 and Cdc25 as functions of
active MPF. (C) Rates of activation
and inactivation of MPF as functions
of MPF activity, from Eq. (B3.2).
The intersection points correspond
to stable (black circles) and unstable
(white circle) steady states of the
dynamical system. (D) Bifurcation
diagram. The steady state values of
active MPF are plotted as functions
of total cyclin B, B
T
¼
[MPF]
þ
[preMPF]. For 0.28
<
B
T
<
0.69, the
regulatory network has three steady
states, two stable (solid lines) and
one unstable (dashed line).
(C)
(D)