Biology Reference
In-Depth Information
BOX 14.2 Anaphase Switch
The dynamic properties of the molecular regulatory system in
Figure B2
A can be described by a set of differential equations
for B
TABLE B2
Parameter values for the Mad2-Cdc20
model
¼
[CycB], M
AT
¼
[Mad2
A
]
free
þ
[Mad2
A
:Cdc20], and
Parameter
Value
Parameter
Value
X
¼
[Mad2
A
:Cdc20],
k
amb
1
K
diss
¼
k
diss
/k
assoc
0.01
dB
dt
¼
k
sb
k
imh
0.01
k
break
¼
k
break
/k
assoc
0.001
k
db
B
k
dbc
C
$
B
;
(B2.1A)
k
break
1
H
1
dM
AT
dt
¼
k
amb
L
$
B
$
M
I
B
T
¼
k
sb
/k
db
1
M
T
2
k
imh
H
$
M
k
break
C
$
X
;
(B2.1B)
C
0
¼
k
db
/k
dbc
0.01
C
T
1
dX
dt
¼
k
assoc
M
$
C
k
dissoc
X
k
break
C
$
X
;
(B2.1C)
where C
¼
[Cdc20]
active
¼
C
T
e X, M
I
¼
[Mad2]
inactive
¼
of the Mad2
A
:Cdc20 complex induced by active Cdc20
itself. The parameter L
M
T
e M
AT
,andM
¼
[Mad2
A
]
free
¼
M
AT
e X.Asusual,C
T
¼
fraction of tensionless chromo-
somes (i.e., replicated chromosomes that are not properly
aligned on the metaphase spindle), and the H
¼
[Cdc20]
total
and M
T
[Mad2]
total
. The rate constants k
amb
and
k
imh
refer to the activation and inactivation of Mad2, k
assoc
and k
dissoc
refer to the association and dissociation of the
Mad2
A
:Cdc20 complex, and k
break
refers to the breakdown
¼
¼
activity of
a counteracting phosphatase.
(A)
(B)
(C)
(D)
M
AT
M
AT
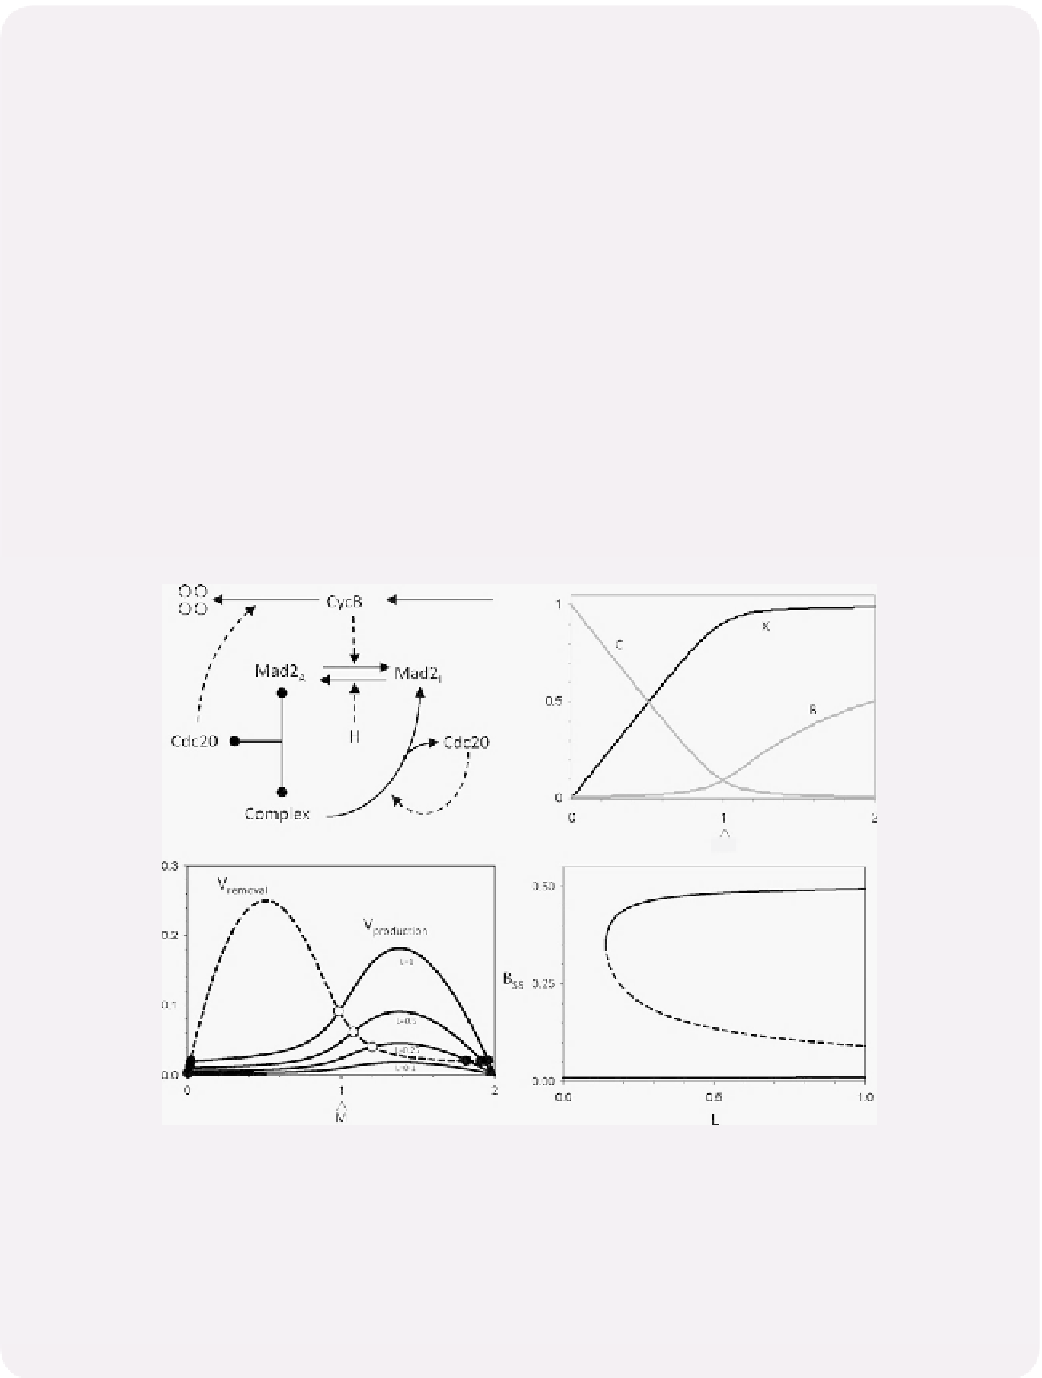
FIGURE B2
Bistability in a model of the anaphase switch. (A) Molecular regulatory network. 'CycB'
¼
CycB:Cdk1 heterodimer, 'Cdc20'
¼
Cdc20:APC complex (an E3 ubiquitin ligase), 'Mad2'
¼
stoichiometric inhibitor of Cdc20:APC. Active Cdc20:APC primes CycB for degra-
dation. CycB-dependent kinase activates Mad2, in conjunction with 'tensionless' chromosomes, L. H
Clb2-counteracting phosphatase. Notice
that active Cdc20:APC promotes dissociation of the Mad2:Cdc20:APC complex. (B) The concentration, X, of the Mad2
A
:Cdc20 complex is
plotted as a function of M
AT
¼
¼
[Mad2
A
]
free
þ
[Mad2
A
:Cdc20]. In addition, we plot C
¼
[Cdc20]
active
¼
C
T
e
X and B
¼
[CycB]
ss
¼
B
T
C
0
/
(C
0
þ
C) as functions of M
AT
. (C) Rates of production and removal of active Mad2 as functions of M
AT
from Eq. (B2.4). The production rate curve
is drawn for several values of L
fraction of tensionless chromosomes. The intersection points correspond to stable (black circles) and unstable
(white circle) steady states of the dynamical system. (D) Bifurcation diagram. The steady state values of M
AT
are plotted as functions of L. For
0.13
<
L
<
1, the regulatory network has three steady states, two stable (solid lines) and one unstable (dashed line).
¼
Continued on next page