Biology Reference
In-Depth Information
where
g
takes values which are typically between 2 and 3.
This finding has profound implications for the architecture of
biological networks, as well as their evolution and func-
tionality. These implications are discussed in the next
section.
strictly banned in narrow degree distributions, is observed in
practically all the analyzed cellular networks, ranging from
the ultra-reactive pyruvate and coenzyme A in metabolic
networks, to the insulin receptor in protein
e
protein inter-
action networks
[2,5]
. This can be seen in
Figure 9.2
(a),
where we display the protein
e
protein interaction network of
S. cerevisiae. In this representation the node size is propor-
tional to its degree, so that the clearly visible variability in
the node sizes illustrates the heterogeneity in their degrees.
While most proteins participate in one, two or three inter-
actions, a few hubs participate in well above 10, and the
degree of some even exceeds 100.
These highly heterogeneous topologies differ essen-
tially from the classic Erd
˝
s
e
R
´
nyi networks, in that they
do not have a typical node. In an Erd
˝
s
e
R
´
nyi network, the
degrees of most nodes are in the vicinity of the average
degree. The scarcity of nodes with any given degree can be
estimated by comparing with the average degree of the
network. In that sense the average degree provides a char-
acteristic scale by which the rest of the nodes should be
measured. In contrast, a power-law degree distribution, of
the form of Eq.
(2)
, allows for the coexistence of nodes with
an extremely broad range of degrees, freeing the network of
any typical scale. The cellular networks are thus scale-free
(SF)
[36]
. Graphically, the power-law degree distribution
forms a straight line when plotted on logarithmic axes, with
the slope providing the scaling exponent,
g
(
Figure 9.3
).
This yields an intuitive illustration for the concept of the SF
topology. It shows, graphically, that one cannot assign
a typical scaling, since the graph duplicates itself regardless
of the scaling used in the horizontal axis (denoting the
degrees).
Of particular significance in the characterization of the
degree distribution is the value of the scaling exponent,
g
.
The broadness of the distribution becomes larger as the
SCALE-FREE NATURE OF CELLULAR
NETWORKS
As the structure of cellular networks was elucidated, it
became evident that their topology does not obey the
typical narrow distribution observed for many other
quantities in nature. Instead of the commonly found
Poisson, Gaussian and exponential distributions, cellular
networks feature a power-law degree distribution. The
first evidence for this came from metabolic networks,
where we take the nodes to represent the metabolites and
the directed links to represent the enzyme-catalyzed
chemical reactions between them. The analysis of meta-
bolic networks from as many as 43 different organisms
revealed that they are all characterized by a power-law
degree distribution
[31]
. Similar findings followed from
the study of protein
e
protein interaction networks
[32]
,
and transcriptional regulatory networks
[38,44]
.
The Scale-Free Property
In contrast to the Poisson (and other narrow) distributions,
the power-law distribution is not concentrated around its
mean. Networks characterized by such a degree distribution
are thus highly non-uniform
e
most of the nodes have only
a few links, whereas a few nodes have a disproportionately
large number of links. These highly connected nodes, often
called hubs, are the glue that binds the majority of low-
degree nodes together. The presence of these hubs, which is
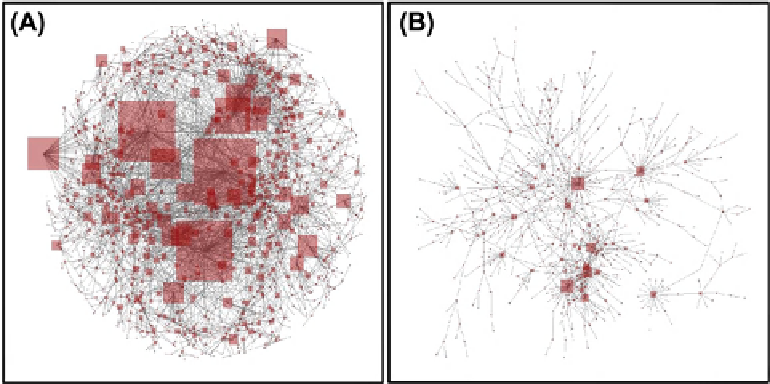
FIGURE 9.2
(A) The yeast protein
e
protein interaction network. The size of the nodes is proportional to their degree. The heterogeneity in the node
sizes serves as a visual expression of the scale-free nature of the degree distribution. (B) A small portion of the network reveals that it is disassortative, i.e.,
that hubs are typically surrounded by low-degree nodes.