Biology Reference
In-Depth Information
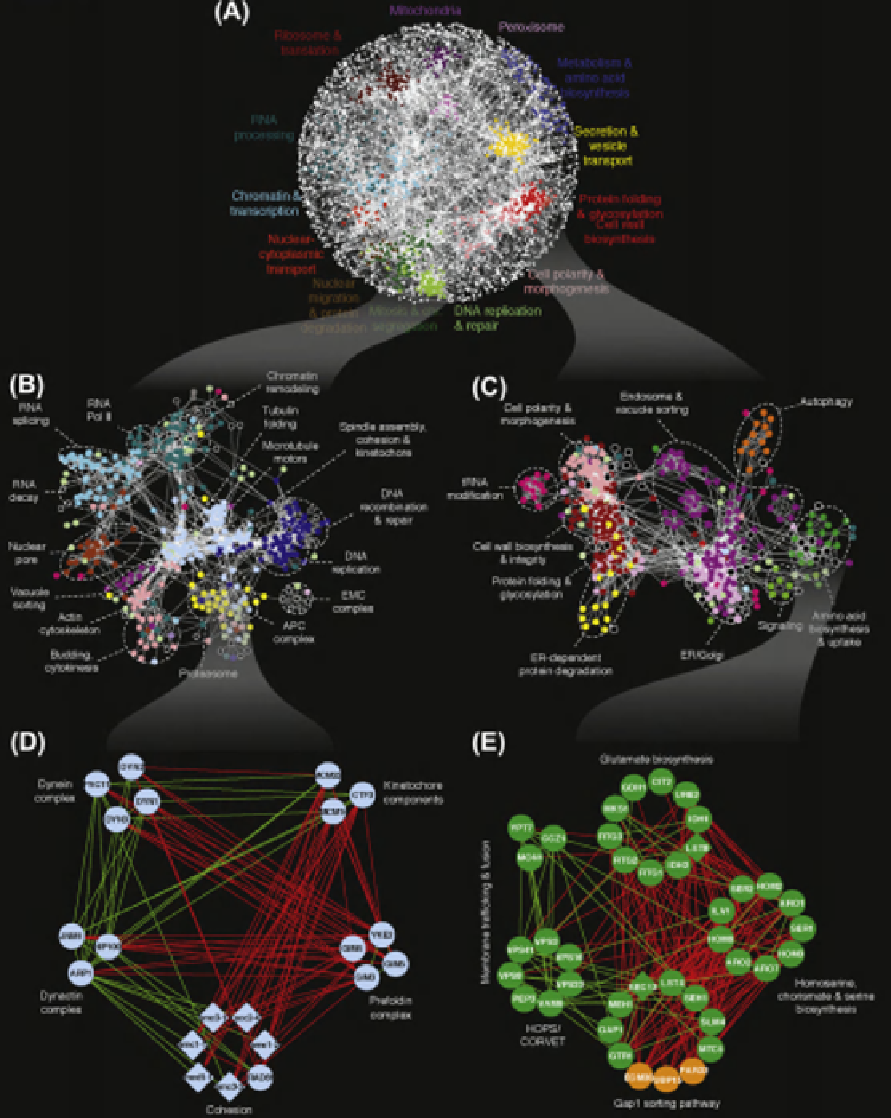
FIGURE 6.2
Genetic network analysis. (A) A correlation-based network connecting genes with similar genetic interaction profiles. Genetic interaction
profile similarities were measured for all gene pairs by computing Pearson's correlation coefficients (PCC) and gene pairs whose profile similarity
exceeded a PCC threshold
>
0.2 were connected in the network using the force-directed layout described in
Figure 6.1B
. (B,C) Magnification of the
genetic network map resolves cellular processes with increased specificity. Sub-networks correspond to the indicated region of the global map described in
(A). Node color corresponds to specific biological processes. Color schemes are unique to each panel in the figure. (D,E) Further magnification reveals
modules corresponding to specific pathways and complexes connected by negative and positive genetic interactions. Subsets of genes belonging to spindle
assembly, cohesion and kinetochore (D), as well as amino acid biosynthesis and uptake (E) regions of the network were selected. Genes are represented as
nodes grouped according to profile similarity and edges represent negative (red) and positive (green) genetic interactions. Characterized genes are shown
in blue (D) or green (E), while genes with previously unknown function are indicated in orange. Modified from
[2]
.